Hello,
I’m plotting a band structure for a hexagonal 2D material cell along the band path
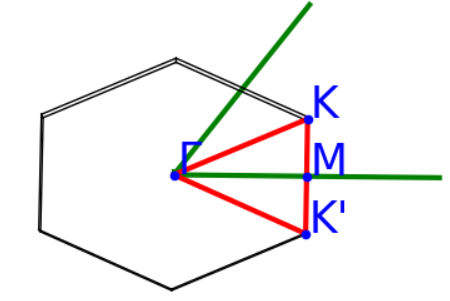
<0,0,0> <1/3,1/3,0> <0.5,0,0> <2/3,-1/3,0> <0,0,0>
Calling BSPlotter.plot_Brillouin() gives the expected result
but the band structure plot shows a different distance between K-M and M-K’
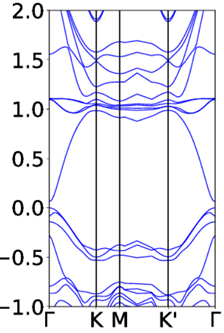
Does anyone have a good way to fix this band structure plot?
Hi @Steven_Hartman,
Apologies for the delay, working through a backlog of posts. Did you resolve this issue, or is the bug still present as far as you know?
Best,
Matt
Unfortunately, I don’t remember what material this was for, or what version of Pymatgen I was running at the time. My current setup works correctly for the hexagonal materials I’m studying now - I think it was just one particular calculation that it didn’t like.