Dear LAMMPS users,
I am trying to calculate “local atomic ratio” which was referred by [1]. In this paper, Atomic fraction of Ni in the total system is plotted and visualized at different simulation time steps. I tried many keywords to search the command, but could not find it.
Anyone knows how to calculate atomic fraction in the system, or knows the command?
Thank you in advance.
Jeongwoo Lee
Following pictures are from [1]
[1]Henz, Brian J., Takumi Hawa, and Michael Zachariah. “Molecular dynamics simulation of the kinetic sintering of Ni and Al nanoparticles.” Molecular Simulation 35.10-11 (2009): 804-811.
Please explain briefly what the calculation is - I (and others)
do not want to read a paper to figure it out.
Steve
Sorry for inconvenience, Steve and all.
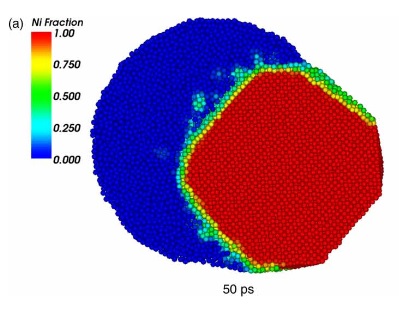
The paper shows a simulation of sintering process of Ni and Al atoms. When nanoparticles of solid Ni and liquid Al contact each other, Ni atoms diffuse into liquid Al, forming a NiAl alloy phase.
Somehow, the paper shows local atomic fraction of Ni element in the system. That is, the atoms in the system was colored in red-blue scale showing Ni fraction contained, red showing Ni fraction of 1 and blue showing Ni fraction of 0. As simulation time goes on, as more Ni atoms diffuse into liquid Al and form NiAl phase, initially shown as group of red(Ni) and blue(Al) nanoparticles become green(Ni fraction of 0.5 which is NiAl) starting from the interface of the two nanoparticles.
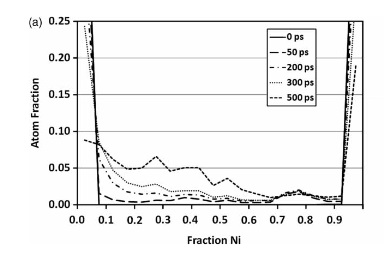
Also, the paper presented plots of “fraction of Ni” vs. “atom fraction”. showing distribution of Ni fraction among the system. The x-axis, fraction of Ni, scaled from 0 to 1. At the beginning of the simulation, when two elements(Ni and Al) has not interacted yet, the plot showed values only for Ni fraction of 0 and 1(x-axis), showing U shape. As more Ni and Al toms form NiAl phase, the plot shape became W shape, showing center peak at Ni fraction of 0.5.
Since the author commented that he used LAMMPS, I was assuming there is a command which calculates such data.
Any comment is welcome.
Thanks in advance.
Jeongwoo Lee
Sorry for inconvenience, Steve and all.
The paper shows a simulation of sintering process of Ni and Al atoms. When
nanoparticles of solid Ni and liquid Al contact each other, Ni atoms
diffuse into liquid Al, forming a NiAl alloy phase.
Somehow, the paper shows local atomic fraction of Ni element in the
system. That is, the atoms in the system was colored in red-blue scale
showing Ni fraction contained, red showing Ni fraction of 1 and blue
showing Ni fraction of 0. As simulation time goes on, as more Ni atoms
diffuse into liquid Al and form NiAl phase, initially shown as group of
red(Ni) and blue(Al) nanoparticles become green(Ni fraction of 0.5 which is
NiAl) starting from the interface of the two nanoparticles.
Also, the paper presented plots of "fraction of Ni" vs. "atom fraction".
showing distribution of Ni fraction among the system. The x-axis, fraction
of Ni, scaled from 0 to 1. At the beginning of the simulation, when two
elements(Ni and Al) has not interacted yet, the plot showed values only for
Ni fraction of 0 and 1(x-axis), showing U shape. As more Ni and Al toms
form NiAl phase, the plot shape became W shape, showing center peak at Ni
fraction of 0.5.
Since the author commented that he used LAMMPS, I was assuming there is a
command which calculates such data.
LAMMPS is a very flexible tool and allows many different kinds of
analysis. there usually isn't just one specific command that does a certain
kind of analysis, but usually people use a combination. now how the
specific calculation that you describe is done, is difficult to say. you
may contact the author or look carefully through the paper and through the
various options in LAMMPS and build an analysis that does what you are
looking for.
axel.
I’m still not 100% clear, but you could look
at the compute coord/atom command. For each
atom it could tell you the number of Ni and Al atoms
that are nearby (within a cutoff).
For a Ni atom surrounded by 2 Ni and 3 Al, you could
interpret that a Ni atom at fraction 0.5 (or maybe 0.4).
If you tally that for all the atoms, you would get a
probability density curve similar to what is in the plot
of your first message. I.e. a value of 0.05 at Ni fraction
0.4 tells you that 5% of the atoms in the system
are locally surrounded by 40% Ni and 60% Al.
But as Axel said, contacting the authors is the best
way to insure you are doing the same thing.
Steve