Yes, it is possible to draw predominance diagrams (or chemical potential diagrams) using MP data, however, it is not available on the current MP website. Note that the next-generation website (coming in the next few months) will likely include auto-generated diagrams.
If you would like to make this plot yourself, please see the following code in pymatgen. You should be able to create these diagrams using MP entry data for the Li-Ni-O chemical system, downloaded via the API.
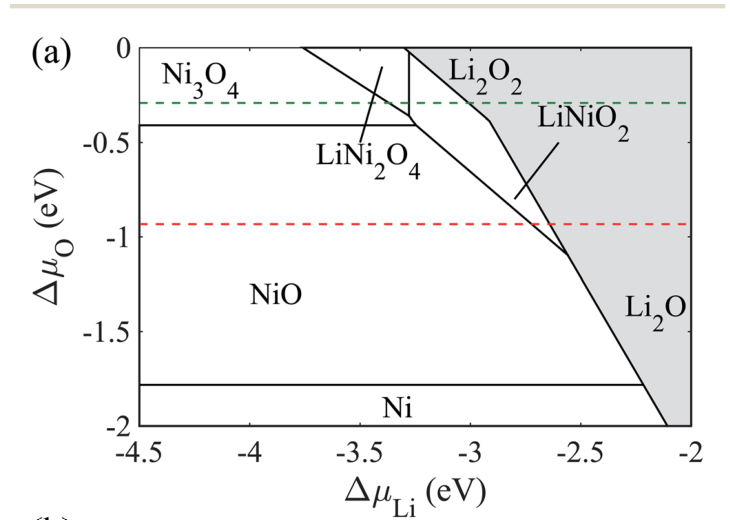
Basic 2D predominance diagrams for ternary systems:
https://pymatgen.org/pymatgen.analysis.phase_diagram.html#pymatgen.analysis.phase_diagram.PDPlotter.get_chempot_range_map_plot
Generalized chemical potential diagrams (NEW – for any system with 2+ elements):
https://pymatgen.org/pymatgen.analysis.chempot_diagram.html#pymatgen.analysis.chempot_diagram.ChemicalPotentialDiagram