computation of power spectrum from compute_vacf

Dear all,

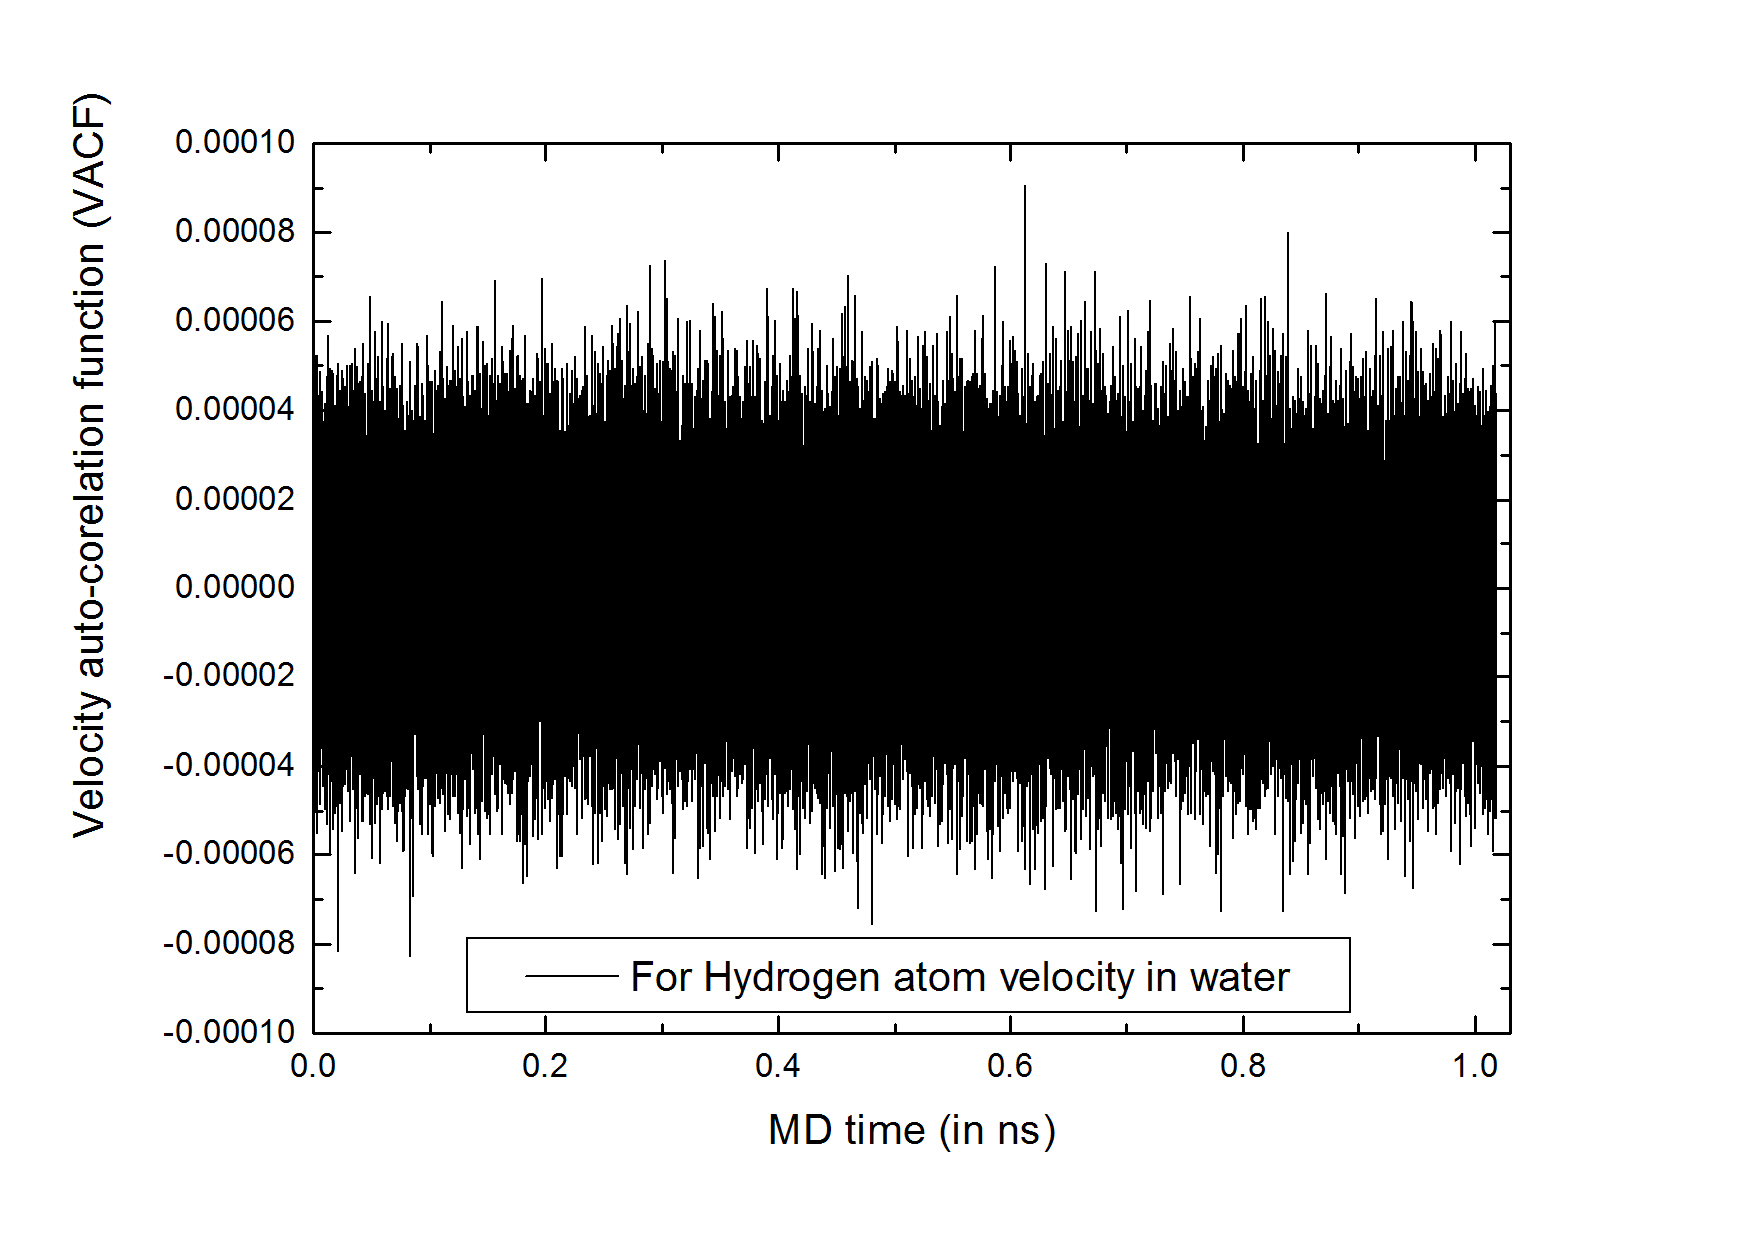
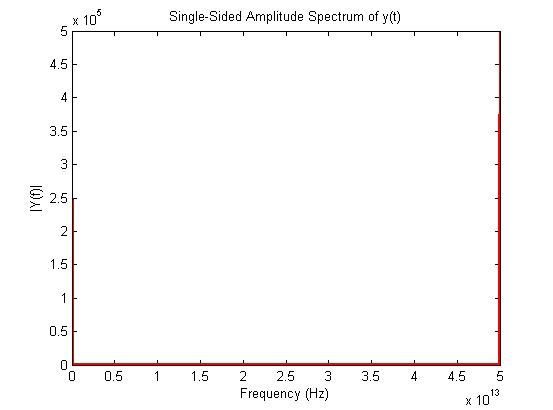
I’m simulating SPC/E flexible water. During the period of equilibration for a timescale of 1 ns, I found that my sample is equilibrated enough, confirmed from different pair-distribution functions and time averaged thermodynamic state variables. But I got problems when I was trying to get the power spectrum of my sample by doing FFT of the VACF of H and O atoms. I just dumped the ACFs of the velocities of H and O atoms in a file and then done FFT in MATLAB, but I got no frequency contains in power spectrum and also the VACF curve looks odd with respect to the published H2O SPC/E flexible ACF curve. Here is my input script for your kind perusal.

units real
dimension 3
boundary p p p
atom_style full
read_data final_water_spc-flexible_data

group ox type 2
group hy type 1
set group ox charge -0.8476
set group hy charge 0.4238

pair_style lj/cut/coul/long 10.0
pair_coeff 2 2 0.1502629 3.1169
pair_coeff 1 2 0.0341116368 2.04845
pair_coeff 1 1 0.00774378 0.98
bond_style harmonic
bond_coeff 1 176.864 0.9611
angle_style harmonic
angle_coeff 1 42.1845 109.4712
kspace_style pppm 1.0e-5

thermo 100

thermo_style custom step v_time press vol v_sysdensity temp ebond eangle edihed eimp evdwl ecoul etail pe ke
thermo_modify flush yes

fix 2 all npt temp 298.0 298.0 50.0 iso 1.0 1.0 500.0
fix 3 all ave/time 1 20000 20000 v_time c_thermo_temp c_thermo_press v_sysvol v_sysdensity v_etotal v_pe v_ke v_evdwl v_coulomb file TD_variables

compute myRDF all rdf 500 1 1 1 2 2 2
fix 4 all ave/time 1 200000 200000 c_myRDF file zhang.rdf.dat mode vector

compute 2 ox vacf
compute 3 hy vacf

fix 13 ox ave/time 1 1 1 v_time c_2[1] c_2[2] c_2[3] c_2[4] file vacf_oxygen.dat
fix 14 hy ave/time 1 1 1 v_time c_3[1] c_3[2] c_3[3] c_3[4] file vacf_hydrogen.dat

neighbor 2.0 bin
neigh_modify delay 0 every 1 check yes

timestep 0.1
run 10000000

VACF-H-atom.JPG

power-spectrum.jpg

hi,

Check the usage of fix ave/time

fix ID group-ID ave/time Nevery Nrepeat Nfreq value1 value2 … keyword args …

Your setting of ave/time is 1 1 1, meaning the correlation time is 1, so mo wonder you only see the white nosie like vacf.

For flexible water, to resolve the high frequency vibration, time step is suggested not to be larger than 0.25 fs. The correlation time determins the freq grid you are looking at.

LC Liu

2014/6/16 下午9:25 於 “liu varsana” <varsanaliu@…33…24…> 寫道:

Hi Liu,
Thanks for your reply. Yes, I got my mistake in ave/time settings. And I’m using 0.1 fs timestep for safely account the frequency of the flexible water. But how can I calculate and/or guess the correlation time to resolve that high frequency domain ? Is there any rule or idea by which I can make a initial guess ?

Thanks again for your time.

Sorry I’ve used my lab mate’s (Rajdeep’s) mail id unknowingly. Sorry Rajdeep. Actually we access a single machine.

Regards,

Liu Varsana.

the simplest way is to dig out the literature. I did something similar before, so I am sure that someone has done this. Howeve I can not recall the name right now. Spend some time and play with Google scholar.

LC Liu

2014/6/16 下午11:22 於 “Rajdeep Behera” <rajdeepbehera87@…24…> 寫道:

Sorry I gave a wrong answer to VACF. You should not use ave/time for outputting VACF.

Here is a sample input file for how I did the calculation. vacf.dat then contains the VACF plot for further FFT calculation.

compute VACF------------------------------------------------------------

compute oxvacf ox vacf
compute hyvacf hy vacf
compute allvacf all vacf

variable mox equal c_oxvacf[4]
variable mhy equal c_hyvacf[4]
variable mall equal c_allvacf[4]

fix fixprint all print 1 “{phytime} {mox} {mhy} {mall}” file vacf.dat screen no

fix fixnve all nve

run 100000

1 Like

Dear Liu,

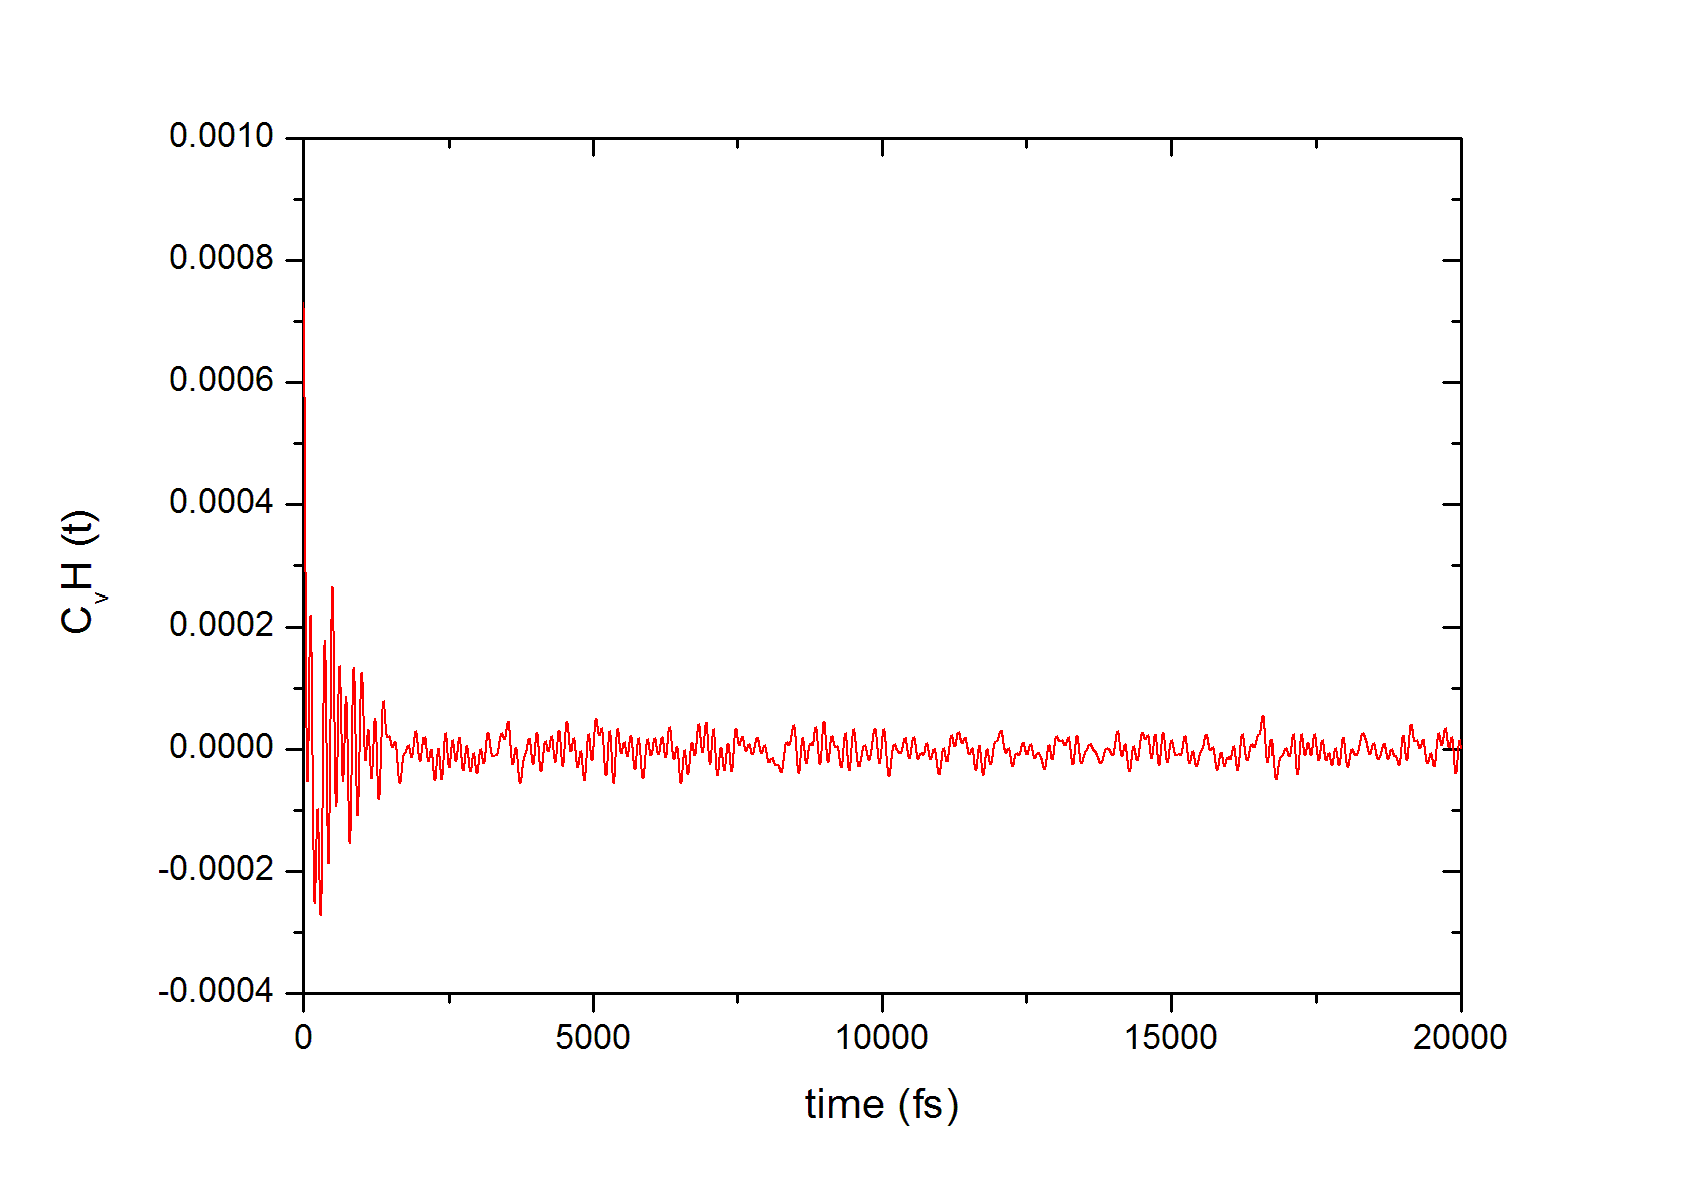
I’ve tried with ave/time settings “2 1 2” with time step =0.25 fs, i.e the correlation time was 0.50 fs. In this ave/time settings no averaging was done. But in the ACF curve of Hydrogen atom, I saw no convergence to zero. I have attached the curve for your perusal.

BTW I’ve searched and gone through a lot of literature, but have not found one which have given the correlation time for their power spectrum.

Anyway I’m trying with a series from 0.25…0.50…0.75…1.0 fs etc. Any idea ?

ACF-Hydrogen.PNG

check this one out

http://dx.doi.org/10.1063/1.476350

Also be aware that only one set of VACF does not give you smooth enough curve for FFT. You need to add and average many sets.

Thanks for help. But I also had take this paper as the benchmark but unfortunately they have not given the correlation time for their ACFs curves, they only have written that the time step was 0.2 fs in the last of the computational details para. Anyway thanks again.

  1. The length of correlation time determines the lower end of your frequency spectrum. So it is your job to decide.

In the sample code I gave, the length is simply the run time step times the step size.

  1. As I said, you need multiple VACF to average out. This one paper tells you to use 1400 sets. http://dx.doi.org/10.1063/1.3515262

I guess that the VACF in your previous email only capture one set. In that case, the curve is of course noisy.

  1. I suggest to match your RDF with the 1998 paper. They did a very concise study on this. Make sure that you have a correct equilibrium state before going to VACF.

LC Liu

(ps. Liu is my last name but first name)