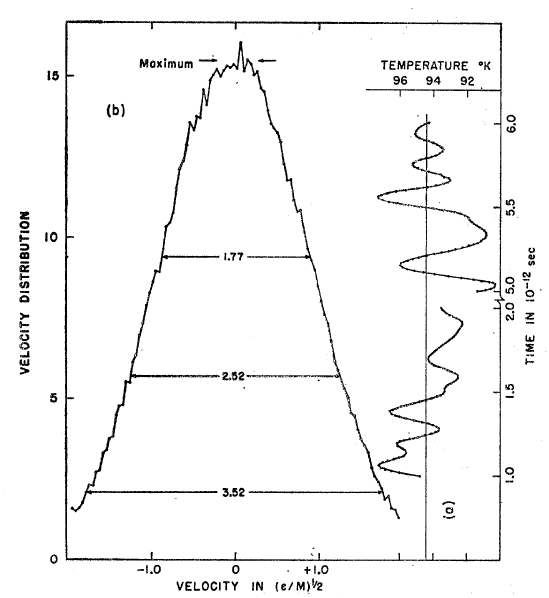
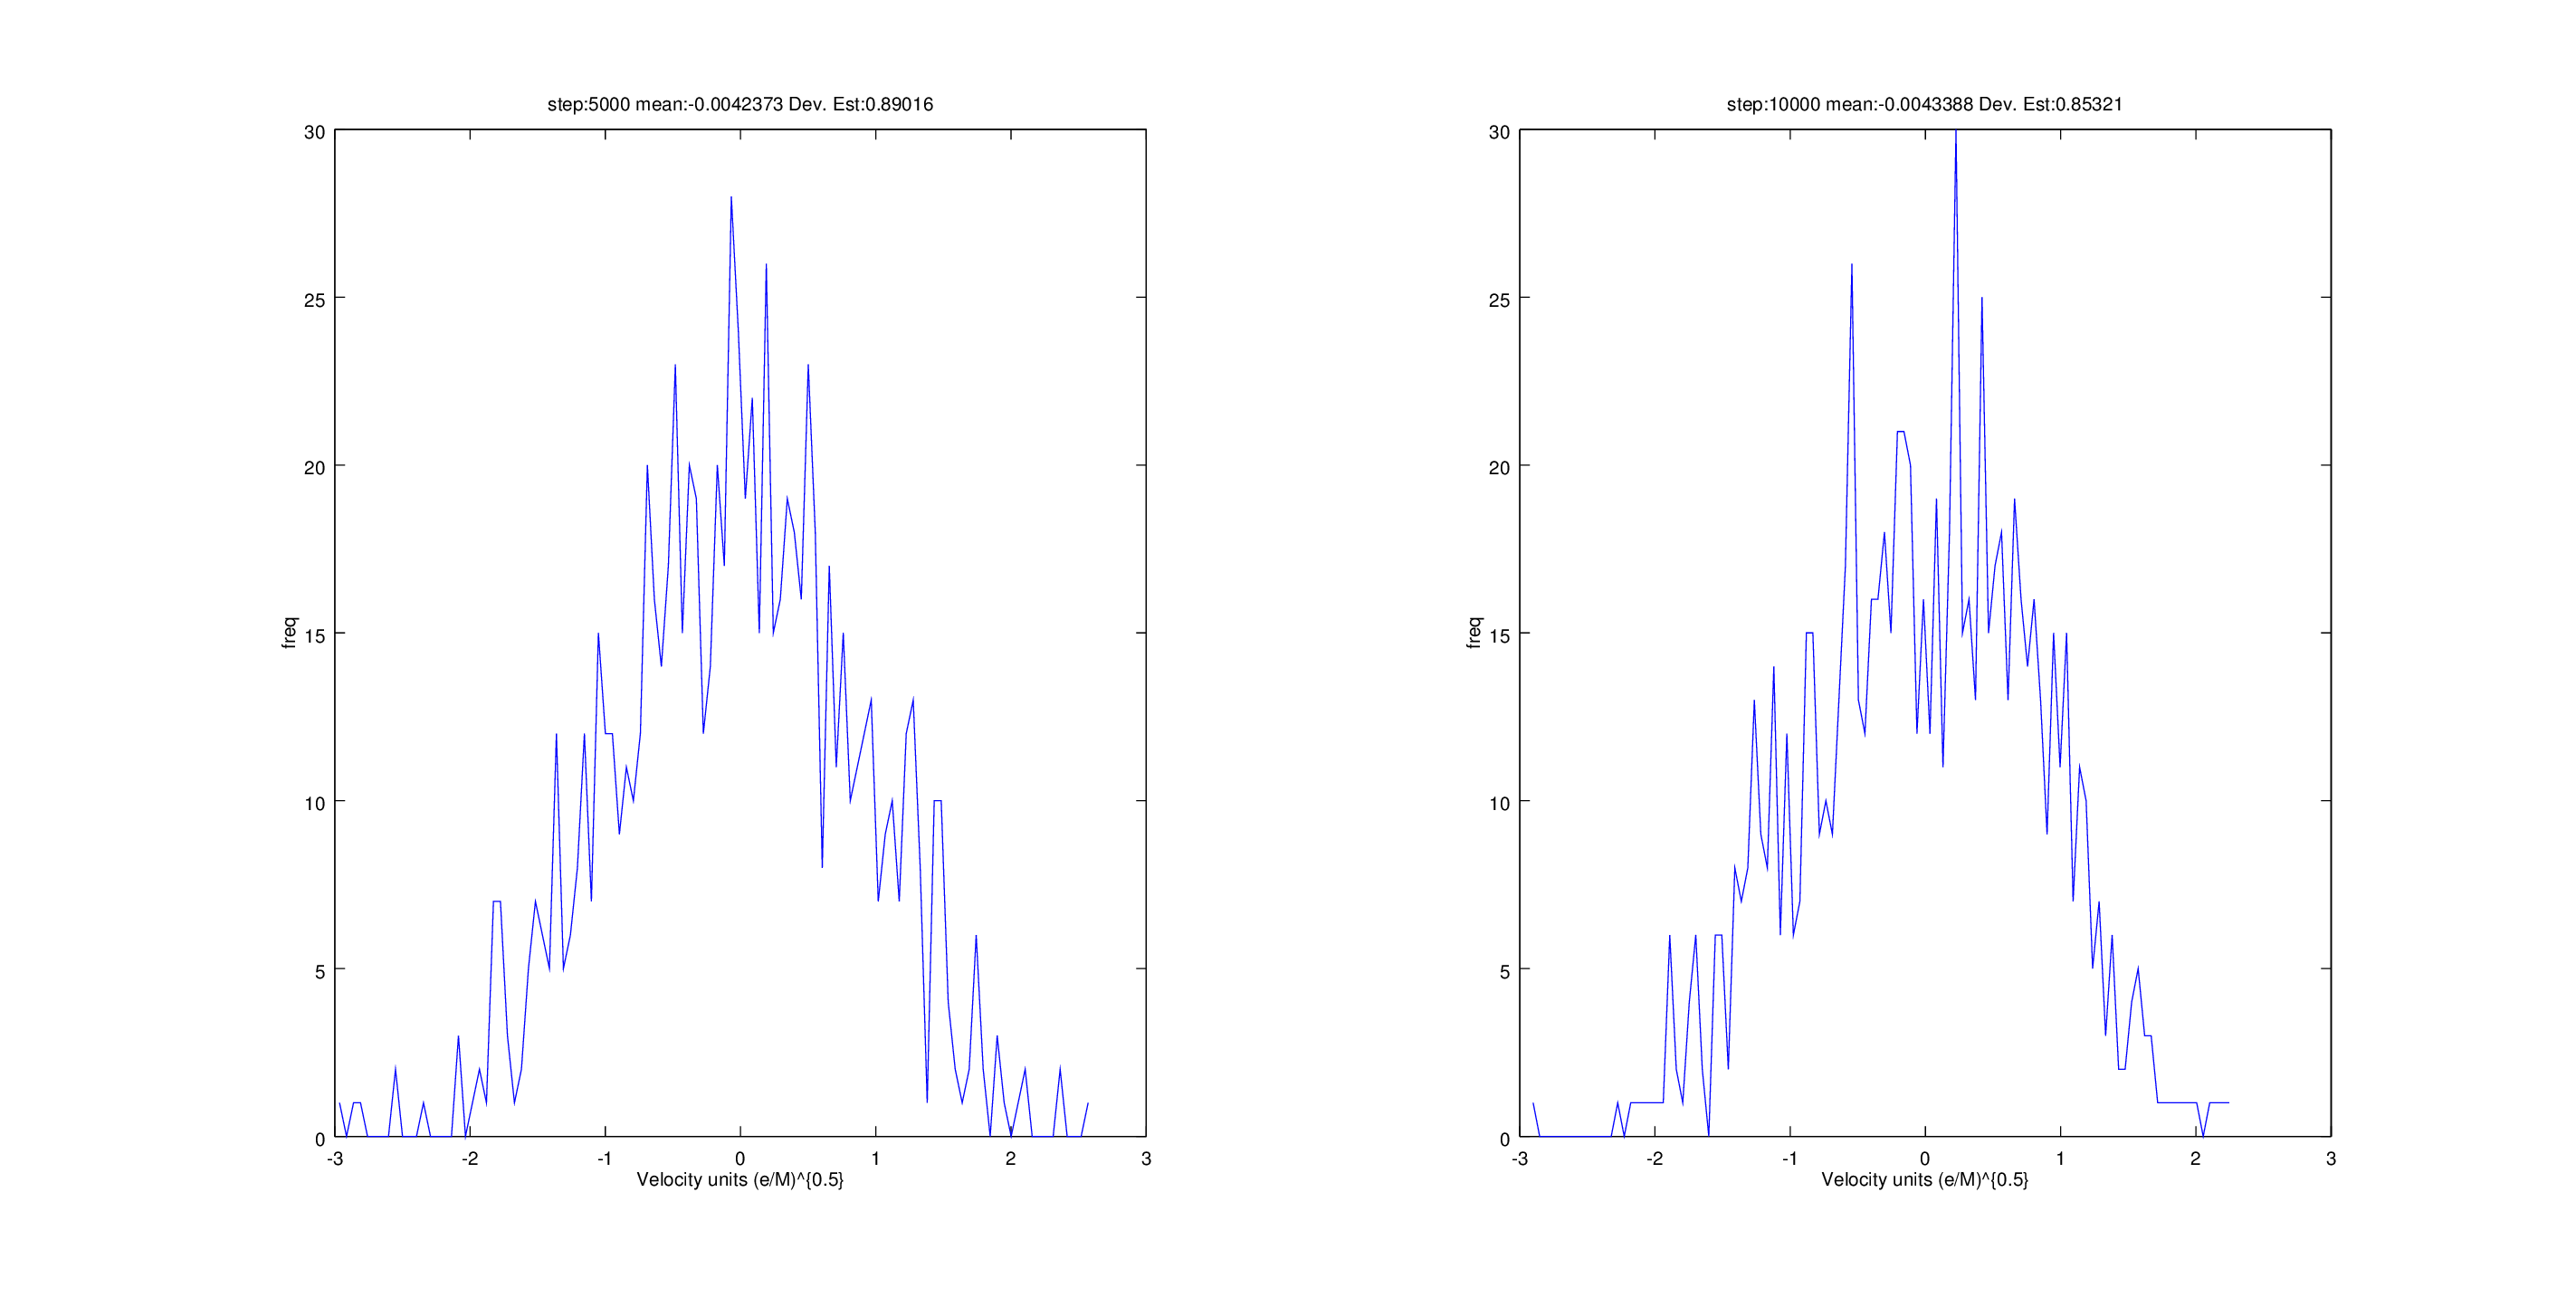
Dears , I would like to know why the Gaussian bell me is not as perfect as he got rahman with the technology of 50 years ago . In lammps I make a similar simulation to that I do rahman , including a finer temperature control , but still the Gaussian is not as good as that obtained rahman .
The data histogram(output.png) has 108 bins. They are about those who could count manually from Figure rahman article . In the mean and standard deviation values I get are very close to those of rahman , however my gaussian is not so soft and the height is different.
Rahman use the predictor - corrector algorithm while lammps (fix NVE ) use verlet , which is better.
Try a temperature control with a larger window, try NVT but always get the same thing.
Is there a problem with the approach I am saying ?
I attached my code.
Regards.
in.simulacion (2.4 KB)
This is not really a LAMMPS problem I think, more of a postprocessing question. If your mean and variance are approximately the same I think it just means you need to do more averaging. The Gaussians you obtain look like a single time step, it might make sense to use fix ave/histo to create a nicer/better averaged histogram, see here: http://lammps.sandia.gov/doc/fix_ave_histo.html
As additional note, using temp/rescale for any sort of sampling is a very bad idea, you really should use a better thermostat.
Just to reiterate what Stefan said, you need to average over many
independent configurations. You script implies that you are using just
1 or 2 configurations:
variable intDump equal ${N_pasos}/2
From the figure, it appears that Rahman ran his simulation for 6 ps,
quite an achievement back in 1965. You can be sure that he did not
waste any data, so he probably used on the order of 1000
configurations, consistent with the 20-30x reduction in noise
amplitude compared to your graph.
Aidan
Thanks for the answers Stefan and Aidan , help me a lot . Sorry if the questions are very trivial .
I understand , I have not done a good statistic.
I showed only time steps , but have not averaged.
I tell a little of what he was trying to do these days:
Home init.sh simulation using the script , which launches 40 simulation runs with different seeds each, for different initial configurations. Each run is 10,000 time steps , equal to 100ps .
variable intDump equal ${N_pasos}/2
2 configurations generated by simulation run , I use the last configurations to each simulation run . So I get 40 configurations, generated a data matrix with these 40 setups and then performed statistical promerdio :
sum ( 40 config) / 40
That 's what I’m trying to do, however, it is even worse Gaussian XD.
I’ll do what you recommend me and tell them I went .
greetings
init.sh (360 Bytes)
Thank you very much , finally understood the way the average is performed.
Use the following statement :
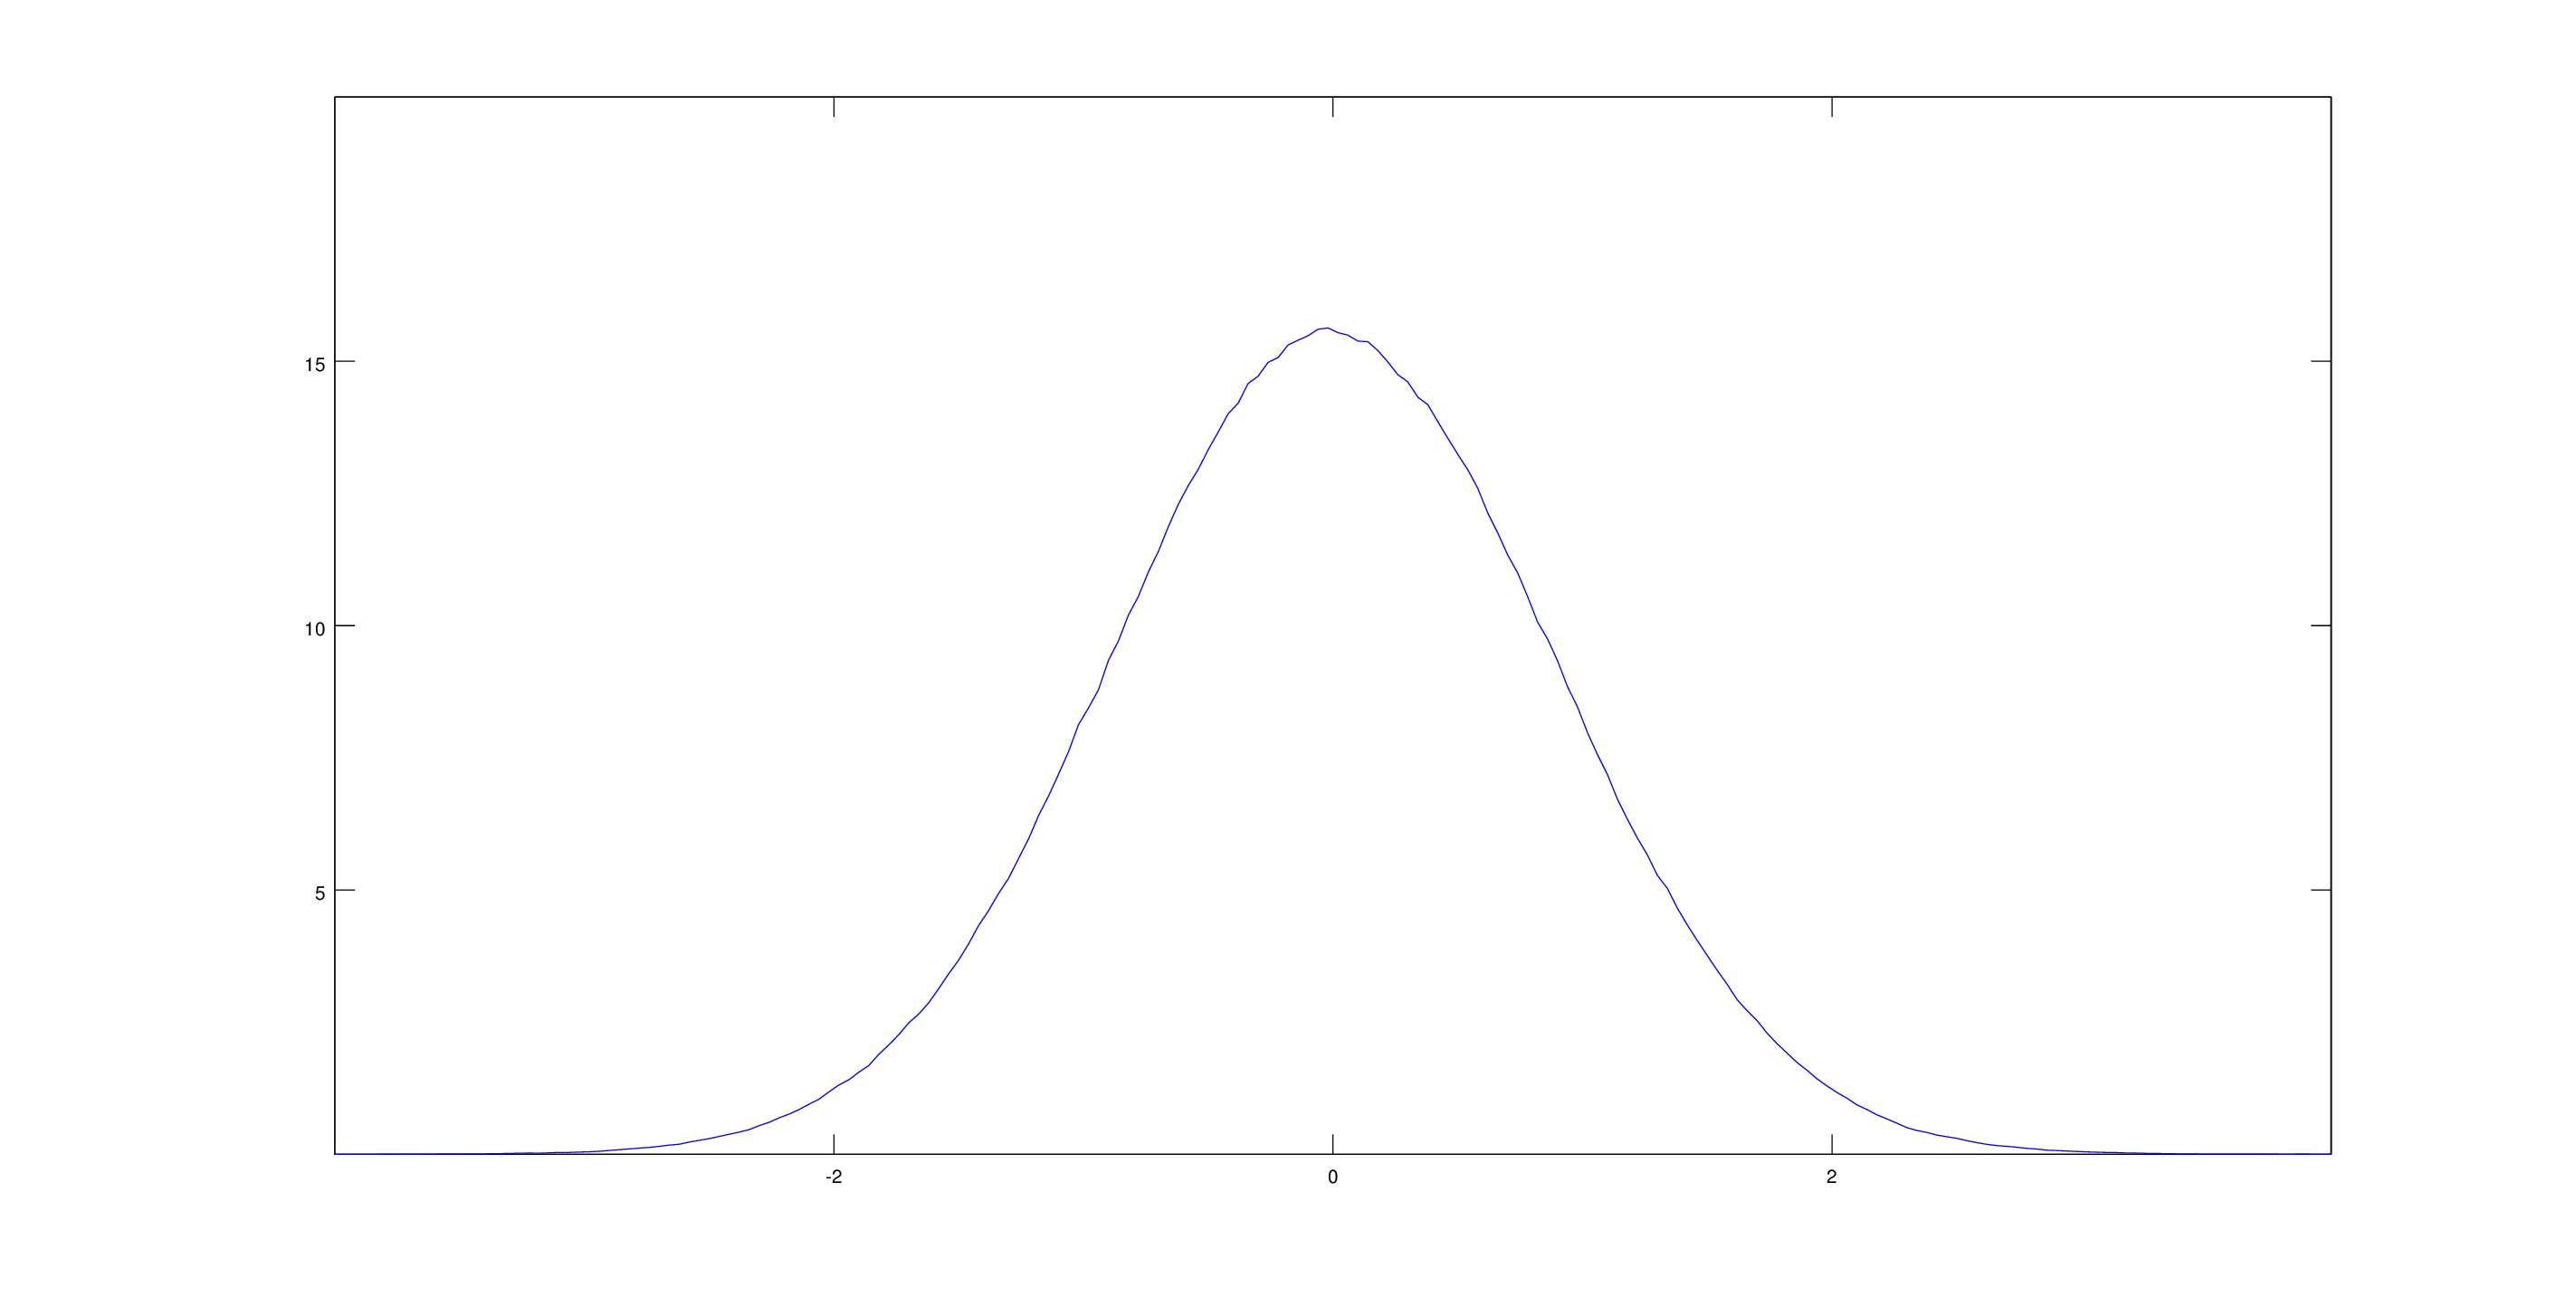
fix 1 all ave/histo 1 1000 1000 -4 4 112 v_vx_N mode vector ave running beyond extra file histograma.dump
And then draw the histogram with octave . The new Gaussian obtained (attached ) to the x component of the velocity is much softer .
Rahman tremendous achievement for before 1965 , considering the computing capacity at his disposal .
Regards
Hello again,
What is the most convenient method to calculate the mean and standard deviation of an amount which has been obtained with ave / histo ?.
In particular I refer to the graph of velocity components ( gaussian ) . I would calculate the mean value and standard deviation of the gaussian to see if it fits what I should get .
Regards
Hello again,
What is the most convenient method to calculate the mean and standard
deviation of an amount which has been obtained with ave / histo ?.
In particular I refer to the graph of velocity components ( gaussian ) . I
would calculate the mean value and standard deviation of the gaussian to see
if it fits what I should get .
if the distribution is indeed gaussian, then you should start looking here:
http://lmgtfy.com/?q=mean+and+standard+deviation+of+gaussian+distribution
Sorry , I think I do not express well . Of course you understand what a Gaussian distribution and what is its mean value and its standard deviation and obviously I began by google . Perhaps the translation from Spanish into English I came out defective.
My question to mention how to calculate these values in numerical form using a fix or compute or even a post -processing tool of the best from the experience you have . Currently I calculate these values from the dump tilizando awk and octave , my calculations are pretty close to expectations . But I arose the question of whether someone from the mailing list with more experience than me, performs calculations using only lammps .
Sorry for the inconvenience
You could calculate directly the mean and squared mean of your data using fix ave/time, and get the variance from that.
If you want to calculate it using only the bins in the histogram then you will need to post-process. I usually use Python scripts.
Related to Niall’s comment, the variable command has
a function ave() which can be used on the output of the fix ave/histo
command. That value could also thus be printed with thermo
output or used as input to fix ave/time to do a time average of it.
It wouldn’t be hard to add a sigma() or variance() function to
the variable command, which would work similarly.
Steve
Niall , Steve
Thanks for the suggestions , review what they mention. As Steve says it would be great to have a future sigma () function for variable command.
greetings
Niall , Steve
Thanks for the suggestions , review what they mention. As Steve says it
would be great to have a future sigma () function for variable command.
only that it would not work correctly for your case. what you need is:
Sum_i (n_i * x_i) / Sum_i (n_i) = <x>
what ave() can do is
Sum_i (x_i) / Sum_i(1)
or
Sum_i (n_i) / Sum_i(1)
with x_i being the centers of your histogram slots and n_i the number
of entries per slot i.
accordingly for sigma, you need to compute:
sqrt( Sum_i( n_i * x_i**2) / Sum_i (n_i) - <x>**2)
which won't be possible either unless you implement versions that take
weights as a second argument.
that being said, i don't see much of a point in accumulating this
during the simulation, since the histogram contains practically the
same information. the errors due to the granularity from binning
mostly cancel and thus should be negligible compared to the overall
errors of your simulation.
axel.
Dr. Axel thanks for the suggestion , had not taken into account what you mention. See what I can do about it.
greetings