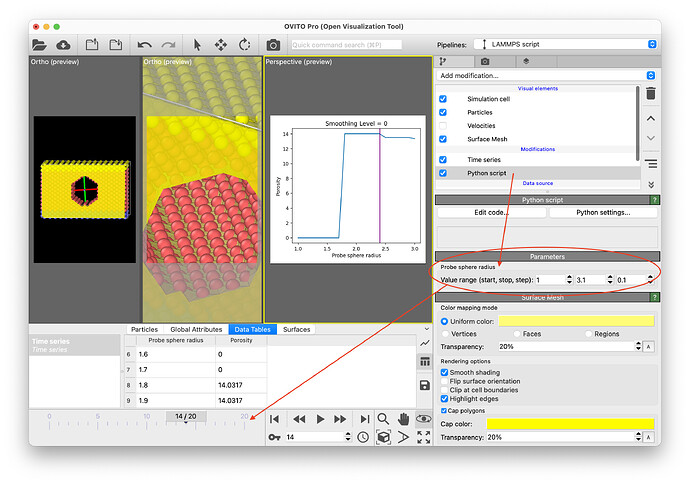
Great! Here are some additional tips for you and others reading this: If you’d like to experiment with a more interactive version of this parameter study, you can use OVITO Pro’s advanced Python API. Once you’ve loaded a static frame into OVITO’s interactive viewport, the following Python modifier code will generate individual animation frames for each value within the specified probe sphere radius range (highlighted in red in the screenshot). By pressing the play button, you’ll be able to see the resulting Surface Meshes.
from ovito.data import DataCollection
from ovito.modifiers import ConstructSurfaceModifier
from ovito.pipeline import ModifierInterface
import numpy as np
from ovito.traits import Vector3, OvitoObject
from traits.api import observe
from ovito.vis import SurfaceMeshVis

class ParameterStudy(ModifierInterface):
    r = Vector3(default=(1.0, 3.1, 0.1), label = "Value range (start, stop, step)", ovito_group = "Probe sphere radius")
    mesh_vis = OvitoObject(SurfaceMeshVis, title="Surface Mesh")

    def compute_trajectory_length(self, **kwargs):
        return len(np.arange(*self.r))

    def modify(self, data: DataCollection, *, frame: int, **kwargs):
        data.apply(ConstructSurfaceModifier(
            method = ConstructSurfaceModifier.Method.AlphaShape,
            radius = np.arange(*self.r)[frame],
            smoothing_level = 0,
            identify_regions=True,
            vis = self.mesh_vis))
        data.attributes["Porosity"] = data.attributes['ConstructSurfaceMesh.void_volume']/data.cell.volume*100
        data.attributes["Probe sphere radius"] = np.arange(*self.r)[frame]

    # This is needed to notify the pipeline system whenever the animation length is changed by the user:
    @observe("r")
    def anim_duration_changed(self, event):
        self.notify_trajectory_length_changed()
In a next step, you can then use the Time Series Modifier to generate the data table containing the evolution of calculated porosity values and add a Data Plot Viewport Layer to easily generate an animation like the following:
This is all based on this code-example given in the OVITO python reference:
https://www.ovito.org/docs/current/python/modules/ovito_pipeline.html#ovito.pipeline.ModifierInterface.compute_trajectory_length
