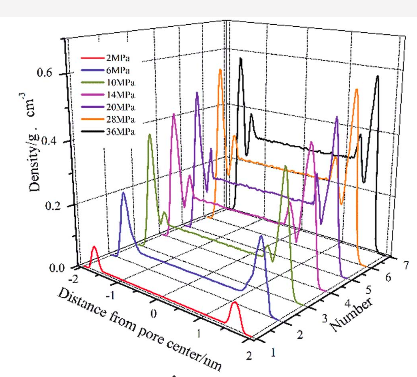
I am running MD simulations in a slit pore. I would like to know if it is possible to use my output files to plot a density profile in the Z direction using lammps.
In the y axis I would have : Density g/cm3
In the x axis : Distance from pore center in nm
I am attaching a picture as an example.
Thank you
