Steve, LAMMPS users,
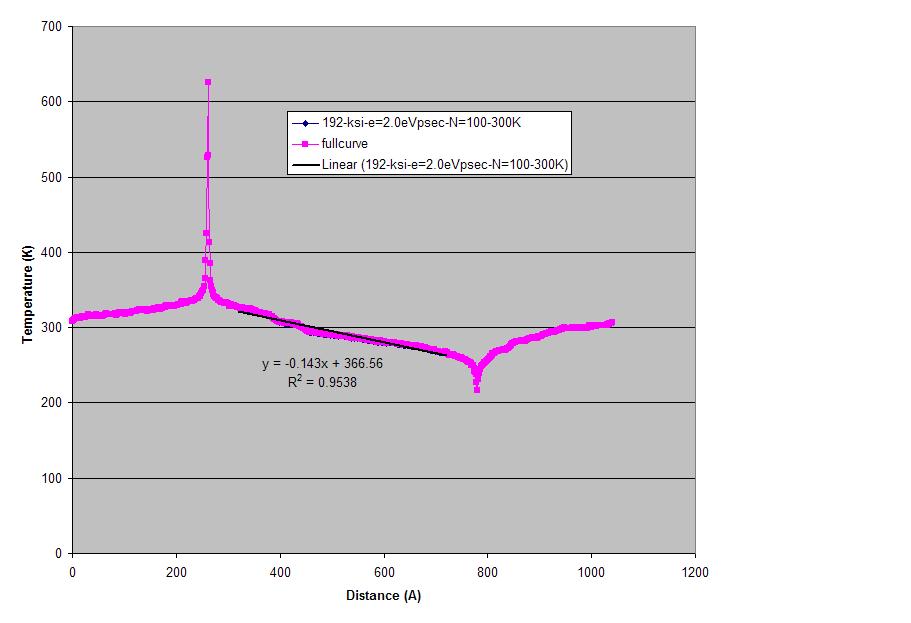
I am using fix heat to generate a temperature profile in a silicon (Stillinger-Weber potential) domain. The attached figure shows a sample temperature profile. The amount of heat added and removed from the “hot” and “cold” region in the domain are the same, but it appears the positive spike in the hotspot is much higher than the negative spike in the coldspot. These hot and coldspot regions are non-equilibrium regions, but it is not clear why there should be such a difference in the magnitude of the spikes.
A different aspect is that the plot of the thermal conductivity versus domain length using fix heat is not giving the “linear” behavior that I see when using fix thermal/conductivity (Muller-Plathe). This linear trend for the inverse of thermal conductivity versus the inverse of domain length (while using fix thermal/conductivity) also yields infinite-length (bulk) thermal conductivity that compares well with the experimental thermal conductivity data of isotopically pure silicon over a large temperature range (300-1000K).
I was wondering if you had thoughts and if the type of temperature profile in the attached figure is something others also have encountered while using fix heat.
The area under the T curve is probably a more useful metric than the magnitude of the spikes. Even so, just because you’re pulling equal and opposite energy from either side of your box, it doesn’t necessarily guarantee that the regions’ accumulated thermal energy should be equal and opposite. From your message, it isn’t even clear to me that your simulation has reached a steady state condition where such comparisons would begin to be meaningful. Assuming that the plot you sent does represent steady-state behavior, it still does not strike me as an incorrect result. As your system size gets larger and the gap between the heated (cooled) regions grows, I’d expect you’d see more and more bulk-like behavior.
I’ve not used fix thermal/conductivity, but in looking at the docs, I see that the heat flux is imposed by the fix. So it wouldn’t surprise me that it gives a nice linear profile. On the other hand, the region between two fix heat regions is unconstrained, and can show boundary layer effects. The situation is analogous to viscosity calculations done via “fix viscosity” versus actually modeling the walls and moving them in opposite directions. If all you want is a bulk value for the thermal conductivity, with no boundary layer or surface effects, I’d recommend you stick with “fix thermal/conductivity.”
Paul,
I think the results arguably have reached steady-state. It is interesting to see your comment about the difference between the two fixes (fix thermal/conductivity and fix heat).
Actually, bulk thermal conductivity is something I am extracting only to compare numerical results to available experimental data and establish confidence in the code/method. The real research interest is in interfacial thermal transport (between two solids) with all the associated boundary/surface effects.
Paul,
I just wanted to mention - I had a simulation box size specification error in the fix heat simulations which was the source of the discrepancy between my results obtained using fix heat and fix thermal/conductivity.
At least for silicon at 300K, I now get a very good match (for the thermal conductivity versus domain length curve) between fix heat and fix thermal/conductivity. Of course, with fix heat, I continue to get positive and negative spikes which are not equal in magnitude - but I am looking at the linear region between the spikes and sufficiently away from the spikes in order to extract the thermal conductivity information.