Results obtained and compared with LAMMPS

Dear Steve and Axel,

I have run the input script provided in the example directory of LAMMPS. I am running my simulation on Intel Xeon 3.20GHz (4 CPU) (32 bit) machine with LAMMPS 31-Aug-2011 version and simulation is carried on single processor. I am getting results which is differing from the one provided with LAMMPS. I am attaching the compared results in tabulated excel sheet.

I want to know whether the obtained difference in result is acceptable or not.

Also, I have carried out other simulation for Fe-Ni binary alloy system.

I have defined a bcc structure of Iron of varying lattice parameter and introduced Nickel with set/fraction command. Initial velocity is created, then the system is minimized with minimize command and relaxed with NVE ensemble. Then I have maintained temperature of 298 K with NVT ensemble and final again using NVE ensemble to get the thermodynamic outputs. Time averaging is done to get the average properties as referred in LAMMPS manual.

Lattice parameter is varied from 2.8 to 2.9 Angstrom and potential energy is measured at each step.

Below is the graph showing the obtained results.
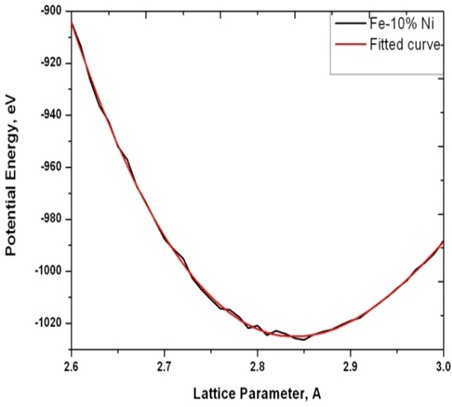
lat_par_vs_energy.jpg

My ques are:

  1. The way I set up the problem in LAMMPS is correct. ?

  2. Why ain’t smooth curve is obtained. ? Or is this variation accepted .

Below is the input script.

To verify/calculate the lattice parameter of Iron.

Lattice parameter is decided by plotting energy values at # various lattice spacing.

log Fe-10%Ni.lammps

variable y equal 2.80

label iterations

atom_style atomic

units metal

boundary p p p

lattice bcc $y

region box block 0 5 0 5 0 5

create_box 2 box

create_atoms 1 box

set group all type/fraction 2 0.10 34245535

pair_style eam/alloy

pair_coeff * * Fe-Ni.eam.alloy Fe Ni

timestep 0.001

velocity all create 298.0 1234567

min_style cg

minimize 10e-5 10e-5 50000 50000

thermo_style custom step temp pe ke etotal press pxx vol

thermo 1000

thermo_modify lost ignore

fix 1 all nve

run 10000

fix 2 all nvt temp 298.0 298.0 10.0

fix 3 all temp/rescale 1 298 298 1 1

run 30000

fix 4 all nve

fix 5 all langevin 298 298 0.1 654866

fix 6 all press/berendsen iso 0.0 0.0 1.0

run 10000

variable e equal pe

variable v equal vol

fix 7 all ave/time 1 1000 5000 v_e

fix 8 all ave/time 1 1000 5000 v_v

run 15000

variable t equal f_4

variable y equal f_5

print “The current lattice parameter value is $y”

print “The current potential energy value is $t”

variable y equal $y+0.01

clear

if “$y <= 3.0” then “jump latpar iterations”

Thanks,

Agraj Abhishek

Results Compared Table.xls (51 KB)

Dear Steve and Axel,

I have run the input script provided in the example directory of
LAMMPS. I am running my simulation on Intel Xeon 3.20GHz (4 CPU) (32
bit) machine with LAMMPS 31-Aug-2011 version and simulation is carried
on single processor. I am getting results which is differing from the
one provided with LAMMPS. I am attaching the compared results in
tabulated excel sheet.

i don't have time to look through lots of numbers,
and particularly excel spread sheets.

what kind of differences are you seeing and
_why_ do you believe this is in error?

we have had many discussions on this mailing
list about how reproducible numbers are with
MD simulations (which are in essence chaotic),
so i don't want to repeat that here again.
please search through the mailing list archives
and also read through MD text books and discuss
with your advisers. this is basic MD stuff
and doesn't need an expert's eye to look at.

I want to know whether the obtained difference in result is acceptable
or not.

your results won't get any better or worse after
somebody steve or me has "blessed" them. the question
is more whether you trust yourself to have achieved
the correct result. if you are not certain, then you
should try a simpler problem and see if you can get
something that you trust. and then analyze the more
complex calculation again and decide whether it is
in error or correct. as for the fluctuation of the
energies with respect to the lattice constant: think
about what would happen if you have a scenario is
such that an atom is almost outside the cutoff distance
and then you reduce the cutoff distance a tiny bit.
then in a second case you increase the lattice constant
for a little bit, but keep the cutoff constant...
what would happen to the total energy of your system?

cheers,
    axel.

Agraj,

If you want a plot of PE as a function of the lattice parameter, you just have to do several NVT runs till till the system reaches equilibrium at different values of your lattice parameter. I have done simulations to obtain “total energy” as a function of “lattice parameter” for Cu and Ni and obtained smooth curves (we do this to do a fit to a Murnaghan Equation Of State to obtain the bulk modulus and unit cell sizes at equilibrium of these metals as part of validation of the EAM potentials and their implementation in LAMMPS).

If doing this seems a problem, I can send you a sample input file on Monday from work.

Manoj

lat_par_vs_energy.jpg