Navjot,
When you reply to messages from the LAMMPS mailing list, please make sure you “Reply All” so that your reply goes to the list as well as to me (that way the messages are archived so other people can follow along and offer further advice/suggestions).
The way this set of commands works is that it computes the density/number vs distance according to the NFREQ you specified. The first line tells you the timestep, the number of chunks, and the total number of atoms. The number of lines after the first line depends on how many chunks were specified. From your output, I recommend increasing the number of chunks by decreasing the bin thickness. The way these lines are structured is that the first number is the chunk ID, the second number is the number of atoms in that chunk, and the third number is the number density of the atoms in that chunk. That third number is the one you want. If you only want a snapshot of the density profile, you could easily copy and paste that section into Excel or Libreoffice Calc or Google Sheets to then plot it.
Below are the commands I usually use for my own simulations. The part I think you need to change is the number after x/y/z center. My code below will specify bin thicknesses of 1/20 the total length of that dimension. Now, if you do it that way, I think you’ll have to do a run 0 before you write the command so that the variable expands to a number. By the way, my commands below will actually give four numbers: chunk ID, coordinate value, Ncount, and density/mass. I’m not sure which style you used for your chunk/atom commands, but I recommend bin/1d for what you’re looking to do.
compute x all chunk/atom bin/1d x center (lx/20) units box
compute y all chunk/atom bin/1d y center (ly/20) units box
compute z all chunk/atom bin/1d z center (lz/20) units box
fix x all ave/chunk 1000 1 1000 x density/mass file {myid}_bin1d_x.txt
fix y all ave/chunk 1000 1 1000 y density/mass file {myid}_bin1d_y.txt
fix z all ave/chunk 1000 1 1000 z density/mass file {myid}_bin1d_z.txt
Below is sample output from the fix x all ave/chunk command:
Chunk-averaged data for fix x and group file
Timestep Number-of-chunks Total-count
Chunk Coord1 Ncount density/mass
0 22 160928
1 -59.5385 0 0
2 -53.8682 8050 1.07791
3 -48.1979 7961 1.08305
4 -42.5275 8026 1.09505
5 -36.8572 7952 1.08141
6 -31.1869 7901 1.07559
7 -25.5165 8004 1.07451
8 -19.8462 8051 1.08929
9 -14.1758 8109 1.10444
10 -8.50551 8271 1.09853
11 -2.83517 8106 1.08942
12 2.83517 8131 1.10161
13 8.50551 7872 1.0665
14 14.1758 8036 1.09586
15 19.8462 8330 1.10737
16 25.5165 8207 1.08454
17 31.1869 7948 1.0848
18 36.8572 7983 1.09382
19 42.5275 8055 1.07295
20 48.1979 7933 1.06686
21 53.8682 8002 1.11214
22 59.5385 0 0
Hope this helps!
Best Regards,
Will
According to your sttatement
“That third number is the one you want. If you only want a snapshot of the density profile, you could easily copy and paste that section into Excel or Libreoffice Calc or Google Sheets to then plot it.”
To plot density profile i need one more column specifying distance. How would I get that.
I think you would get that by changing your compute chunk/atom command to use bin/1d and adding the units box keywords at the end. What are your compute chunk/atom and fix ave/chunk commands now?
I am using following commands
compute solute1 solute chunk/atom type
fix solute2 solute ave/chunk 1000 1 1000 solute1 density/number file segregated_solutes
I don’t think that will work for what you want. From the documentation, using the type keyword with compute chunk/atom will only give you Nchunks = number of atom types in your system. In your case, there are two atom types so there are only two chunks.
To get the output you want, you need to first define a group containing only your Ni atoms. Then use the bin/1d keyword in compute chunk/atom like this:
compute solute_x solute chunk/atom bin/1d x center 1 units box
compute solute_y solute chunk/atom bin/1d y center 1 units box
compute solute_z solute chunk/atom bin/1d z center 1 units box
fix x solute ave/chunk 1000 1 1000 solute_x density/number file solute1_bin1d_x.txt
fix y solute ave/chunk 1000 1 1000 solute_y density/number file solute1_bin1d_y.txt
fix z solute ave/chunk 1000 1 1000 solute_z density/number file solute1_bin1d_z.txt
I follows your instructions and tried to ran input script below and got some error.
units lj
dimension 3
boundary p p p
atom_style atomic
read_data lineplot.data
group solute type 2
mass 1 26.9
mass 2 26.9
pair_style lj/cut 2.5
pair_coeff 1 1 0.50722 2.5 7.5
pair_coeff 2 2 0.50722 2.8 8.4
pair_coeff 1 2 0.50722 2.65 7.95
neighbor 2.0 bin
neigh_modify delay 10 check yes
delete_atoms overlap 1.0 all all
min_style cg
minimize 0.0001 0.0001 1000 1000
compute solute_x solute chunk/atom bin/1d x center 1 units box
compute solute_y solute chunk/atom bin/1d y center 1 units box
compute solute_z solute chunk/atom bin/1d z center 1 units box
fix x solute ave/chunk 1000 1 1000 solute_x density/number file solute1_bin1d_x.txt
fix y solute ave/chunk 1000 1 1000 solute_y density/number file solute1_bin1d_y.txt
fix z solute ave/chunk 1000 1 1000 solute_z density/number file solute1_bin1d_z.txt
dump pics3 all cfg 5000 model.*.cfg mass type xs ys zs
dump_modify pics3 element Al S
timestep 0.005
run 5000
ERROR: Compute chunk/atom for triclinic boxes requires units reduced (…/compute_chunk_atom.cpp:394)
Last command: compute solute_x solute chunk/atom bin/1d x center 1 units box
Note: here S stands for solute atoms. there are not exactly Ni atoms.
Change units box to units reduced.
I ran the simulation sucessfully and got three output files.
One of them is as follows:
Chunk-averaged data for fix x and group file
Timestep Number-of-chunks Total-count
Chunk Coord1 Ncount density/number
1000 2 620
1 0 320 0.000301262
2 1 300 0.000282433
2000 2 620
1 0 320 0.000301262
2 1 300 0.000282433
3000 2 620
1 0 320 0.000301262
2 1 300 0.000282433
4000 2 620
1 0 320 0.000301262
2 1 300 0.000282433
5000 2 620
1 0 320 0.000301262
2 1 300 0.000282433
How would I plot concentration vs distance. Fourth column will give me one axis. How would I plot distance against this axis.
From your results, you would plot the fourth column (density) against the second column (distance/coordinates), but you would only have two data points. How large is your simulation box? I think setting the bin thickness to 1 is too large. I recommend trying 1/10-th or 1/20-th of your length dimension as the thickness. If you’re not getting very many bins, decrease the thickness of the bin and run again.
My box dimentions are lx=255 Å, ly=20.1 Å ,lz=206.2 Å.
Secondly I tried bin thickness to 1/20 of length dimensions. Still I didn’t got very many bins. Then I tried bin thickness to 0.1 and got many bins. I am not able to understand why the values are repeating after some values.
Chunk-averaged data for fix x and group file
Timestep Number-of-chunks Total-count
Chunk Coord1 Ncount density/number
1000 10 620
1 0.05 74 0.000696668
2 0.15 70 0.00065901
3 0.25 60 0.000564866
4 0.35 59 0.000555451
5 0.45 57 0.000536623
6 0.55 52 0.00048955
7 0.65 59 0.000555451
8 0.75 60 0.000564866
9 0.85 67 0.000630767
10 0.95 62 0.000583695
2000 10 620
1 0.05 74 0.000696668
2 0.15 70 0.00065901
3 0.25 60 0.000564866
4 0.35 59 0.000555451
5 0.45 57 0.000536623
6 0.55 52 0.00048955
7 0.65 59 0.000555451
8 0.75 60 0.000564866
9 0.85 67 0.000630767
10 0.95 62 0.000583695
3000 10 620
1 0.05 74 0.000696668
2 0.15 70 0.00065901
3 0.25 60 0.000564866
4 0.35 59 0.000555451
5 0.45 57 0.000536623
6 0.55 52 0.00048955
7 0.65 59 0.000555451
8 0.75 60 0.000564866
9 0.85 67 0.000630767
10 0.95 62 0.000583695
4000 10 620
1 0.05 74 0.000696668
2 0.15 70 0.00065901
3 0.25 60 0.000564866
4 0.35 59 0.000555451
5 0.45 57 0.000536623
6 0.55 52 0.00048955
7 0.65 59 0.000555451
8 0.75 60 0.000564866
9 0.85 67 0.000630767
10 0.95 62 0.000583695
5000 10 620
1 0.05 74 0.000696668
2 0.15 70 0.00065901
3 0.25 60 0.000564866
4 0.35 59 0.000555451
5 0.45 57 0.000536623
6 0.55 52 0.00048955
7 0.65 59 0.000555451
8 0.75 60 0.000564866
9 0.85 67 0.000630767
10 0.95 62 0.000583695
Thirdly, what will be the units of values in second column (coord1) and fourth column. when I plotted second and fourth column , I got the following curve which I didnot understood.
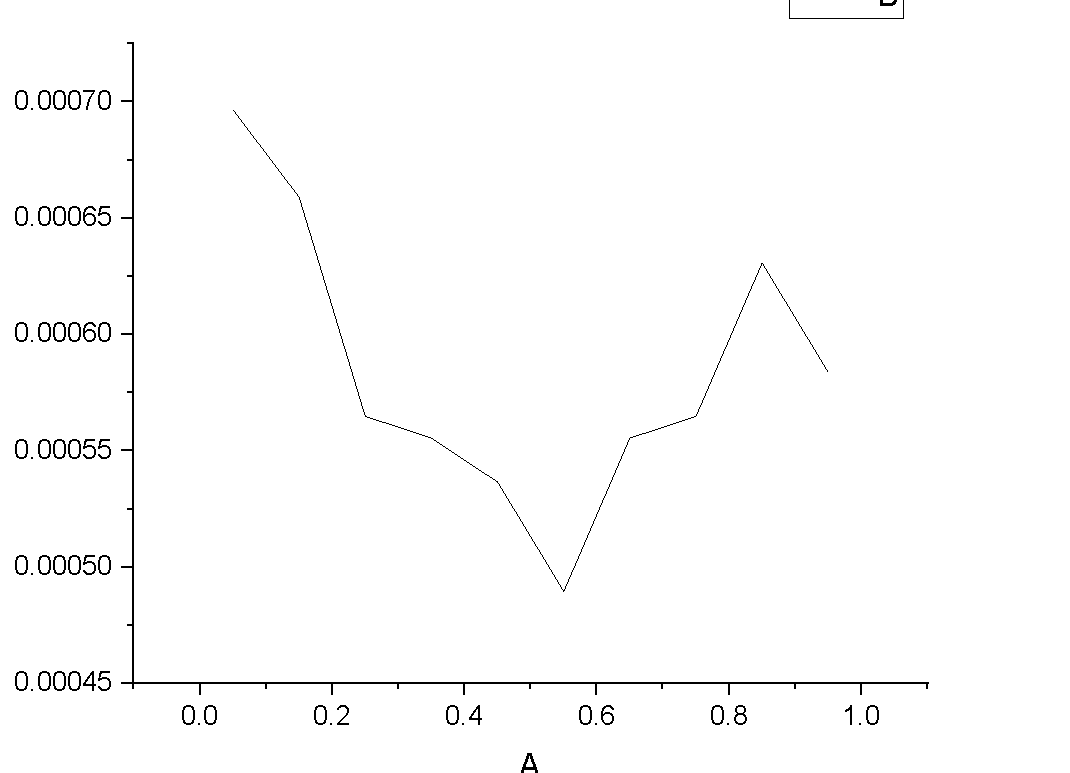
The main reason your profile is repeating is because your simulation ran for more than one set of 1000 timesteps with fix ave/chunk turned on. If you only run for 1000 timesteps (or whatever you set your Nfreq to), you will only get one profile. A secondary reason is that the simulation dynamics are likely at equilibrium and so the profile is not changing (Ni atoms aren’t moving from bin to bin).
As for why your coordinates are not lining up with your box dimensions, it must be due to your box being triclinic.
The documentation (https://lammps.sandia.gov/doc/compute_chunk_atom.html) says “The meaning of origin and delta for triclinic boxes is as follows. Consider a triclinic box with bins that are 1d layers or slabs in the x dimension. No matter how the box is tilted, an origin of 0.0 means start layers at the lower “b” cross “c” plane of the simulation box and an origin of 1.0 means to start layers at the upper “b” cross “c” face of the box. A delta value of 0.1 in reduced units means there will be 10 layers from 0.0 to 1.0, regardless of the current size or shape of the simulation box.”
It sounds like the units for the second column are dimensionless or you could call the units “layers”. If your delta value is 0.01, then you would have 100 layers from 0.0 to 1.0.
As for interpreting your plot:
You grouped your Ni atoms together, right? Then used that group for the compute chunk/atom and fix ave/chunk commands? Then the number density you’re seeing in this plot is strictly for those Ni atoms as a function of distance. Number density is defined as the “average number of atoms per bin divided by volume of the bin”. I don’t use concentration so I looked up the definition and it’s “mass of solute per volume of solution”. So I think you may actually want density/mass, which would be the average mass of atoms per bin divided by the volume of that bin. Since you’re only considering the mass of the Ni atoms, but you’re considering the entire volume of each bin that should be concentration Ni per bin. So your y axis would be concentration of Ni atoms.
Hope that helps!
Best Regards,
Will
Thank you Willliam for you explanation. It is helping me a lot.
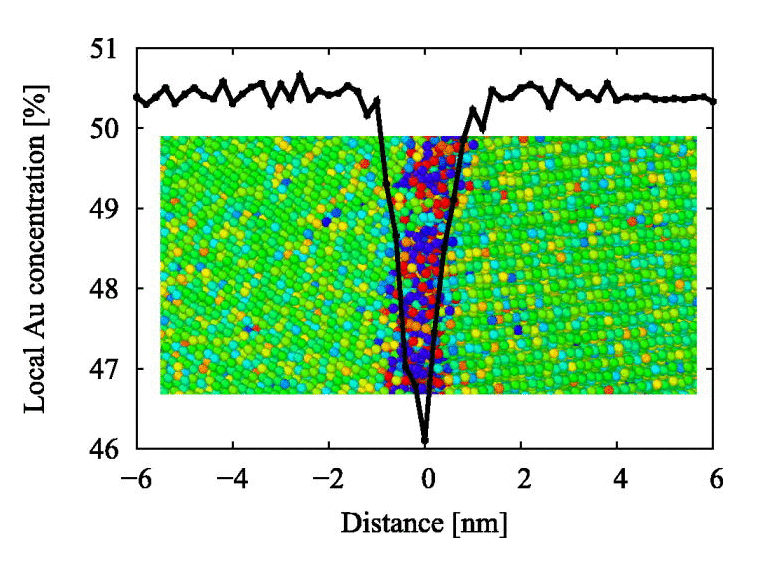
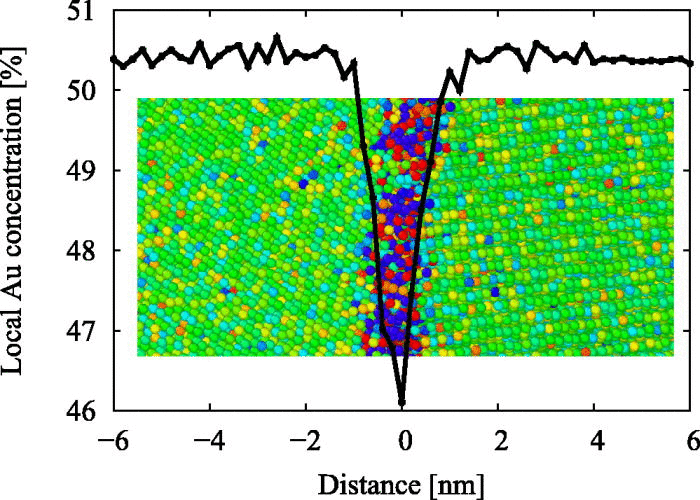
My other concern is that I want line plot showing sudden jump at grain boundary which is segregation site as compate to two grains.
I am expecting something exactly opposite to following curve (I got this curve in some paper): This curve is showing a dip where there is lack of Au concentation vs distance in nm. Here distance ranges from negative to positive, so we can locate grain boundary position at 0. In my case I am getting values from 0 to 1 and as you said they are dimensionless. how will I relate it with position of grain boundary.
If your grain boundary is at 0 A and the box length goes from -L/2 to +L/2, then your density profile will likely be in the same place (as the grain boundary) at 0.5 in that dimension (I’m assuming there’s no tilt to your triclinic box).
If you don’t need your box to be triclinic, then you could change it to orthogonal via the change_box command. If your box is not tilted at all, then the transition from triclinic to orthogonal should be error-free. Performing a density profile with an orthogonal box does not have the same distance unit issue as triclinic boxes. With an orthogonal box, your second column will be in Angstroms (if your units is metal or real).
This transition should be done before you run the density profile, but after you load your data. The following command will change the box from triclinic to orthogonal and remap the atoms such that they fit within the new box (prevents you from losing any atoms and causing an error):
change_box all ortho remap
Best Regards,
Will