Dear all,
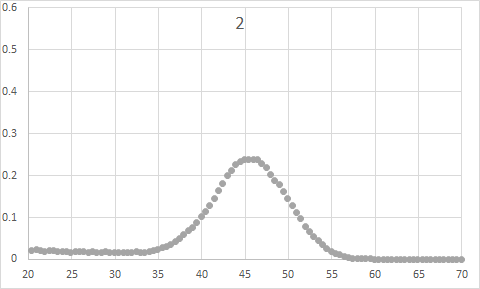
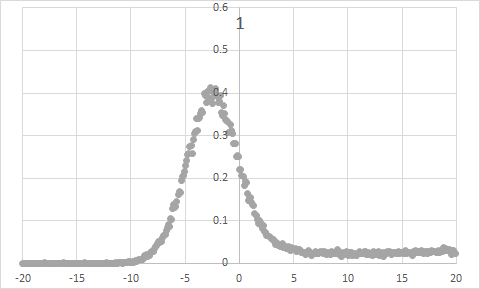
I computed the radial distribution of DMSO (Dimethyl sulfoxide) molecules in a region using the LAMMPS "compute RDF "command, but a strange thing happened: regions with high densities(fig1) of DMSO had smaller RDF peaks(16.9); Conversely, regions with low DMSO density(fig2) have high RDF peaks(22.1).
The density diagram is as follows:
The relevant commands are as follows:
group c2h6so type 6 7 8 9
group Dinter1 dynamic all region inter1
compute dmsordf1 Dinter1 rdf 20 6 6 9 9 6 9
Normally, the smaller the molecular density, the smaller the molecular RDF peak. Why do I have this opposite phenomenon?
Thank you for reading my email.
Best regards
ZZ
Dear all,
[…]
Normally, the smaller the molecular density, the smaller the molecular RDF peak.
please explain the reasoning for this statement.
i strongly disagree with it. from my understanding what the RDF means and what you are computing, I would expect that peaks are higher when the concentration is lower simply because of how the RDF is constructed.
Why do I have this opposite phenomenon?
i think the problem here is your misinterpretation of the meaning of an RDF.
axel.
Thank you for your patient answer, Axel
My understanding is that RDF is a measure of the probability of finding a particle(atom type 6) at a distance of r away from a given reference particle(atom type 6).
So if the higher density means that it has more molecules in a certain region, the greater the probability of finding another particle within a certain distance, the greater the corresponding RDF peak.
zz
That is not correct.
The RDF is the probability to find an atom at a given distance for the given system divided by the probability in an ideal gas.
So you may have a lower probability at lower density to find an atom but that also applies to the ideal gas. Thus at lower density, close atoms “count more” and thus you tend to get higher peaks for attractive particles.
Axel.
Axel, Thank you very much for your response, which has redefined the definition of RDF.
But I am still a little confused, here is a quote from a related literature.
The literature is described as follows
In the system III, the peak at 0.3 nm is the highest, which suggests that the density
of water molecules on the coal surface is the largest, and the wettability changes effectively.
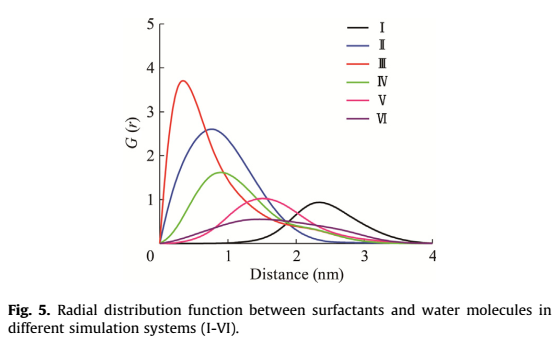
According to this literature, the higher the RDF peak of the surfactant and water, the higher the density of the surfactant’s surface water molecules.
Is this representation correct?
Sorry to bother you again, thank you very much
ZZ
Axel, Thank you very much for your response, which has redefined the definition of RDF.
But I am still a little confused, here is a quote from a related literature.
The literature is described as follows
In the system III, the peak at 0.3 nm is the highest, which suggests that the density
of water molecules on the coal surface is the largest, and the wettability changes effectively.

According to this literature, the higher the RDF peak of the surfactant and water, the higher the density of the surfactant’s surface water molecules.
Is this representation correct?
no.
you cannot say anything about the number of atoms and thus the density from the g(r) function directly. instead if you have to look at the volume integral from 0 to r of g(r) to determine the average number of atoms within a distance range from 0 to r to quantify this. since this effectively multiplies the g(r) graph with a function that scales with O(r**3), having a peak that is wider and shifted to larger r will indicate a much larger number of atoms. when you use compute rdf in LAMMPS, this number is automatically computed (it can be done more accurately when collecting the data for the g(r) rather than doing post processing since you can account for double counting) as the column to the right of the g(r).
from the g(r) you can primarily tell how close atoms are. you can compare peak heights as a measure of numbers/density only if both peaks you compare have the same width, shape and are located at the same value of r. otherwise the non-linear relation between the peak height and number of atoms depending on the value of r will cause significant errors and might lead to complete misinterpretation of the data.
axel.
1 Like
Axel,Thank you very much for your patient clarification. It was so helpful to me. I really appreciate it.