Plot columns from the output files. One of them is the distance (x axis),
another is the RDF (y-axis).
Steve
Plot columns from the output files. One of them is the distance (x axis),
another is the RDF (y-axis).
Steve
I know that, my main question is why the ordinate of my case is so large, while the attachment’s is not. And the x-axis is not enough. Do I need do some data processing?
Cheers,
Yongning
发自我的 iPhone
在 2014年9月24日,21:54,Steve Plimpton <[email protected]> 写道:
I’m not sure what you are asking. If you add the 2 commands from the
compute rdf doc page to bench/in.lj, you will get a tmp.rdf file with
4 columns. The 2nd is the x-axis, the 3rd is the y-axis. The y values
are already going to 1.0 at x = 2.5, which is the usual normalization for g®.
The 4th column is large values, but as the compute rdf doc page explains
those are coordination #s, not g®.
The doc page also explains why you cannot compute g® for distances
larger than the cutoff, and it suggests using the rerun command if
you want to get around that.
Steve
Thanks for your help. I have understood what you said, have another question. How do I use VMD to calculate the RDF figure? I find it is different between them. Attachment 4 is the set of VMD. Are there some problems for it?
Cheers,
Yongning
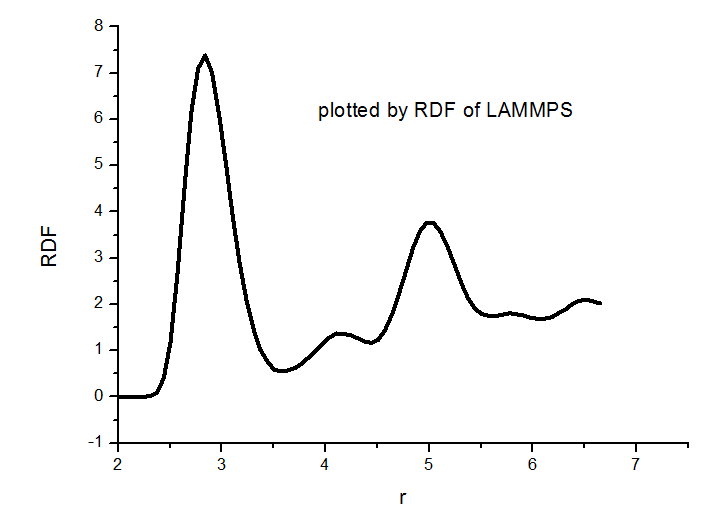
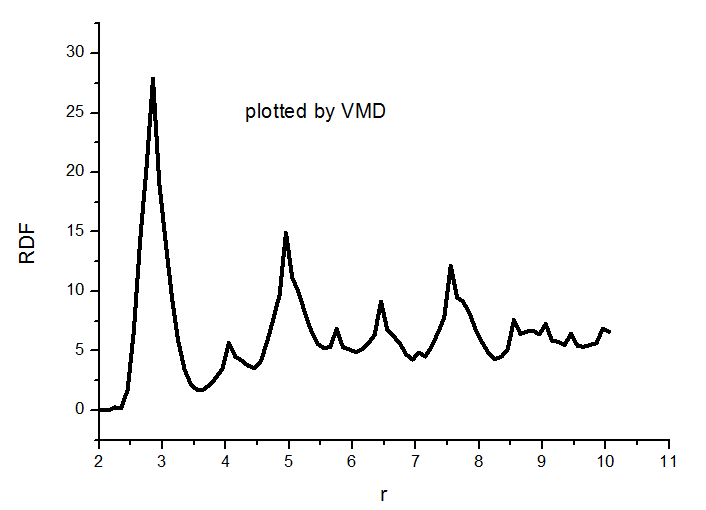
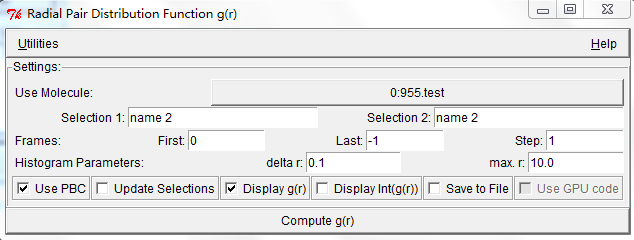
This is clearly the same RDF but generated using different bin sizes, so I guess there is no problem. You can double-check by setting the delta r in VMD (at least, I think that is what your third image is) to the same delta r you effectively have from LAMMPS.
Or on a second note, it could also be that in LAMMPS you did some time-averaging that you did not do in VMD, you might want to check that as well.