Hi all!
After building and plotting a CompoundPhaseDiagram as follows:
with MPRester(key) as mpr:
    entries = mpr.get_entries_in_chemsys("Na-Fe-Nb-O")

pd_feo = CompoundPhaseDiagram(
    entries,
    terminal_compositions=[
        Composition("Na2O"),
        Composition("FeO"),
        Composition("NbO2"),
    ],
)

fig = PDPlotter(pd_feo).get_plot()
fig.show()
I’m interested in plotting a new composition, say Composition("NaFe0.7Nb1.3O4") to see where it sits in the PD.
I’m struggling to make this happen though: I tried simply adding a new go.Scatterternary trace to the plot, but the coordinate system seems different from the simple normalized atomic fractions (see edit).
I also tried implementing a dummy PDEntry.from_dict({"composition":"NaFe0.7Nb1.3O4" , "energy": 0}) before building the PD, in such a way to embed the dummy entry upstream, but the method seems unreliable: most often the dummy phase is not found in the built PD.
I believe the first approach has to be the easier one, but it’s not clear to me how the mapping to DummySpecies actually works. Or maybe it has to do with the fact that the oxidation states of the metals in my composition are not the same as the ones in the terminal compounds? Haven’t seen any mention of ox states in the phase_diagram.py script though.
Any help is greatly appreciated!
Edit:
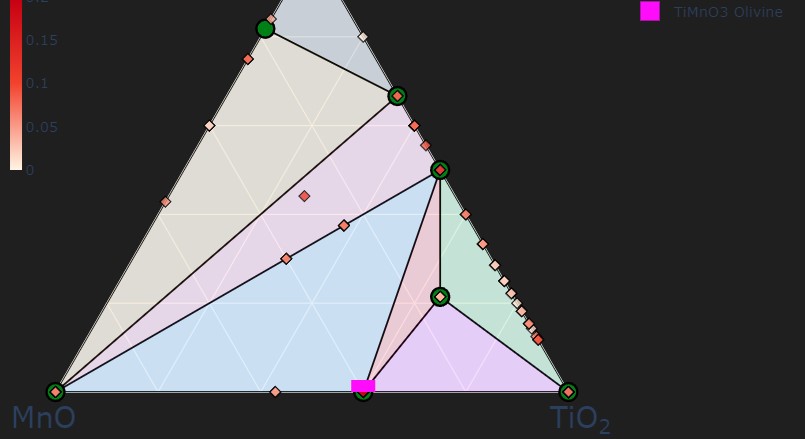
To add on the coordinate system, considering the tie-line MnO-TiO2, why would MnTiO3 (pink square) not sit at 1 MnO : 1 TiO2? It seems to fall automatically in the 3 MnO: 2 TiO2 position.
I also tried implementing a dummy PDEntry.from_dict({"composition":"NaFe0.7Nb1.3O4" , "energy": 0})
This approach works. However, you need to use a much lower energy that would either make the phase stable on the phase diagram, or be within the show_unstable range in PDPlotter.
Still, this approach may not work for a compound phase diagram if the specific ternary slice you are taking does not cut through the equilibrium with your dummy phase. Your intuition about oxidation states is right; this indicates that the phase may not appear in the slice you are taking.
With compound phase diagrams I agree that it would be easier to simply add a point to the plot using plotly, as you mentioned.
To add on the coordinate system, considering the tie-line MnO-TiO2, why would MnTiO3 (pink square) not sit at 1 MnO : 1 TiO2? It seems to fall automatically in the 3 MnO: 2 TiO2 position.
The composition axes in phase diagrams are usually normalized per atom; there are 2 atoms in MnO and 3 in TiO2, so you see a ratio of 3/2. You can change this setting with the normalize_terminal_compositions parameter in CompoundPhaseDiagram.
1 Like
I see, thank you!
I’m having some troubles in calculating the triangular coordinates of an arbitrary composition like Composition("NaFe0.7Nb1.3O4") though.
Digging in the phase_diagram.py script I found (I think?) that the coordinates are based on the get_atomic_fraction function as in [comp.get_atomic_fraction(el) for el in comp.elements], but
how is the atomic fraction processed by PDPlotter?
It all seems to rely on the qhull_data attribute, but I’m struggling to see how this is linked to the atomic fractions/formula of the compound to plot.
How would you calculate the ternary coordinates of say “NaFe0.7Nb1.3O4”, in a compositional PD with terminal compositions Na2O, FeO and NbO2?