Recent LAMMPS releases have added a new GRAPHICS package with several commands that can add extra graphics to visualizations created with the internal dump image command.
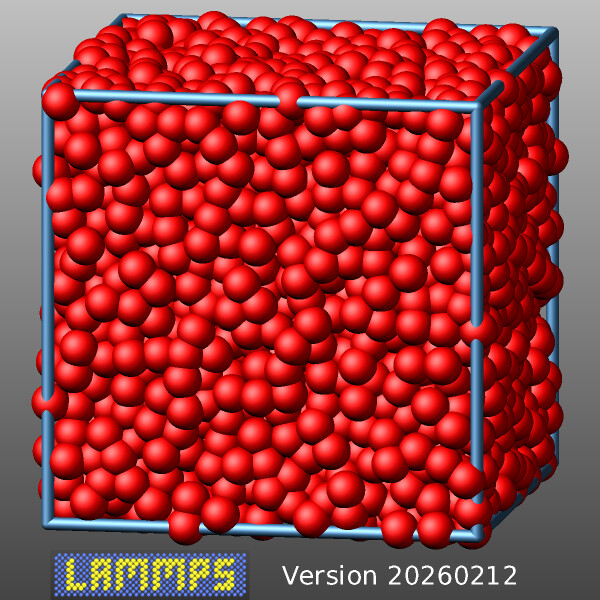
Here is a simple example demonstrating how to add graphics from an image and text with $variable expansion similar to fix print to a visualization (using the melt example input as a base):
# 3d Lennard-Jones melt
units lj
atom_style atomic
lattice fcc 0.8442
region box block 0 10 0 10 0 10
create_box 1 box
create_atoms 1 box
mass 1 1.0
velocity all create 3.0 87287 loop geom
pair_style lj/cut 2.5
pair_coeff 1 1 1.0 1.0 2.5
neighbor 0.3 bin
neigh_modify every 20 delay 0 check no
fix 1 all nve
# dump image frequency
variable vizsteps index 100
# add image and text
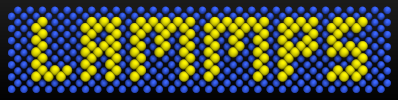
fix logo all graphics/labels ${vizsteps} image lammps-logo.png 150 25 0 scale 0.5
fix text all graphics/labels ${vizsteps} text "Version $(version)" 400 25 0
dump viz all image ${vizsteps} myimage-*.png type type size 600 600 zoom 1.452 &
shiny 0.6 fsaa yes view 80 10 box yes 0.03 center s 0.5 0.5 0.45 &
fix logo type 1 0 fix text type 1 0
# ^^^^ include graphics in images ^^^^
dump_modify viz pad 6 boxcolor steelblue backcolor darkgray backcolor2 silver adiam 1 1.5
thermo 50
run 500
This is what it looks like: