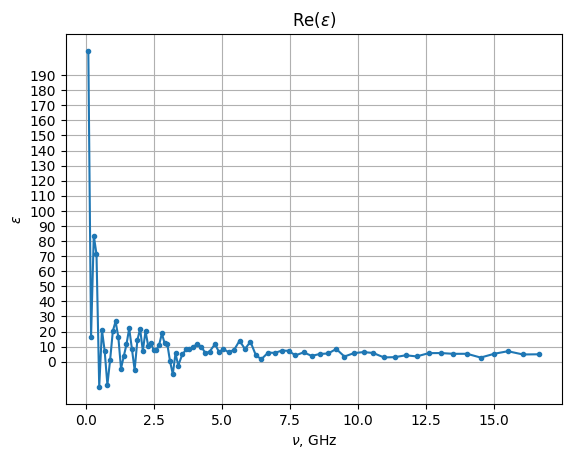
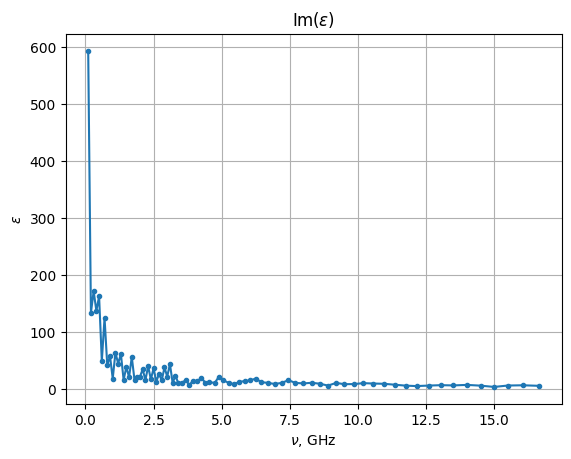
I’m trying to calculate the dielectric permittivity spectrum for a very simple system - just TIP3P water. I’m using MAICoS for this. All the results I got so far look weird, so I’ve tried to increase the system size, the dump frequency and the running time, until I got to 1000 water molecules, dumping every 0.5 ps and running for 10 ns with the NPT ensemble. What am I doing wrong? Can I even accomplish what I’m trying to do with TIP3P water? Sorry if there’s some obvious mistake, I’m very new to this. Here are my LAMMPS config, python script and the graphs I got.
[![Epsilon (real part) vs frequency][2]][2]
[![Epsilon (imaginary part) vs frequency][1]][1]
units real
atom_style full
region box block -20 20 -20 20 -20 20
create_box 2 box bond/types 1 angle/types 1 &
            extra/bond/per/atom 2 extra/angle/per/atom 1 extra/special/per/atom 2

mass 1 15.9994
mass 2 1.008

pair_style lj/cut/coul/cut 8.0
pair_coeff 1 1 0.1521 3.1507
pair_coeff 2 2 0.0    1.0

bond_style harmonic
bond_coeff 1 450 0.9572

angle_style harmonic
angle_coeff 1 55 104.52

molecule water tip3p.mol
create_atoms 0 random 1000 34564 NULL mol water 25367 overlap 1.33

minimize 0.0 0.0 1000 10000

reset_timestep 0
timestep 1.0

fix 1 all nvt temp 300.0 300.0 100.0
run 20000
unfix 1

fix equalize all npt temp 300 300 100.0 iso 1.0 1.0 1000.0

thermo 1000
thermo_style custom step temp press etotal density vol

run 100000
write_data tip3p.data nocoeff
unfix equalize
thermo 100000

fix integrate all nve

dump mydump all atom 500 dump.lammpstrj
run 10000000
import MDAnalysis as mda
import numpy as np
import maicos
import matplotlib.pyplot as plt

path_to_data = "./"
u = mda.Universe(path_to_data + "tip3p.data",
                 path_to_data + "dump.lammpstrj",
                 topology_format="data", format="lammpsdump", in_memory=True)
print(len(u.trajectory))
u.trajectory.ts.dt = 0.5
water = u.select_atoms("type 1 2")

analysis_obj = maicos.DielectricSpectrum(water, df=0.0001, refgroup=water,
                                         output_prefix='water')
analysis_obj.run()
analysis_obj.save()