Below is from my input.xml. I only add the element ‘scrwfplot’ based on the instance of ‘Real-Time TDDFT’ tutorial. When i run it, no error occur but it didn’t generate any additional files besides the original rt-TTDFT results. Could i get the file like ‘WF3D.xml’ in rt-TTDFT calculation?
   <xs
      xstype="RT-TDDFT"
      ngridk="4 4 4"
      rgkmax="5.0d0"
      vkloff="0.01 0.02 0.004"
      nempty="5"
      nosym="true"
      reducek="false">
      <realTimeTDDFT
         propagator="AETRS"
         timeStep="0.25d0"
         endTime="50.d0"
         printTimingGeneral="true"
         calculateNExcitedElectrons="true"
         printAfterIterations="1">
         <laser>
            <trapCos
               amplitude="1.0d0" omega="1.0d0" phase="0.d0"
               t0="0.25d0" riseTime="5.d0" width="30.d0"
               direction="x" />
         </laser>
      </realTimeTDDFT>
      <scrwfplot bandrange="4 5" kptrange="1 2">
         <plot3d>
            <box grid="20 20 20">
               <origin coord="-0.5 -0.5 -0.5"/>
               <point  coord=" 0.5 -0.5 -0.5"/>
               <point  coord="-0.5  0.5 -0.5"/>
               <point  coord="-0.5 -0.5  0.5"/>
            </box>
         </plot3d>
      </scrwfplot>
   </xs>
Dear cooman-long,
thank you for bringing this issue. Actually, RT-TDDFT is not yet implemented to work with scrwfplot.
But if you are interested in visualizing the Kohn-Shan wavefunction at the time given by endTime, you can try a workaround:
- Run your RT-TDDFT calculation as usual;
- Create a new directory and copy to it the following files:
input.xml, all the species files, EVECFV_RTTDDFT.OUT, EFERMI_RTTDDFT.OUT, EVECFV_RTTDDFT.OUT, EVECSV_RTTDDFT.OUT, STATE_RTTDDFT.OUT.
- Rename all the files with the extension
_RTTDDFT.OUT so that they end with .OUT. For example, STATE_RTTDDFT.OUT should be renamed to STATE.OUT.
- Edit your
input.xml, to make sure that:
a. you remove the entire element xs.
b. in the element groundstate, use do="skip", and set ngridk, rgkmax, vkloff, nempty, nosym, and reducek as you had previously in the xs element.
c. Add the properties element as given in this tutorial How to Visualize Kohn-Sham States - exciting
In your example, your input.xml could look like:
...
<groundstate
      do="skip"
      ngridk="4 4 4"
      rgkmax="5.0d0"
      vkloff="0.01 0.02 0.004"
      nempty="5"
      nosym="true"
      reducek="false"
   ...>
 ...
</groundstate>
<properties>
       <wfplot>
         <kstlist>
            <!-- (k-point index) (state index)-->
            <pointstatepair>1 4</pointstatepair>
         </kstlist>
          <!-- WF in the crystal unitcell-->
         <plot3d>
            <box grid="20 20 20">
               <origin coord="-0.5 -0.5 -0.5"/>
               <point  coord=" 0.5 -0.5 -0.5"/>
               <point  coord="-0.5  0.5 -0.5"/>
               <point  coord="-0.5 -0.5  0.5"/>
            </box>
         </plot3d>
       </wfplot>
    </properties>
...
Note that with ... I omitted some elements and attributes, that you perhaps will need to specify.
Please, let me know if this solution works or not.
Best regards,
Ronaldo Rodrigues Pela
Dear Ronaldo Rodrigues Pela,
Thank you for your help,
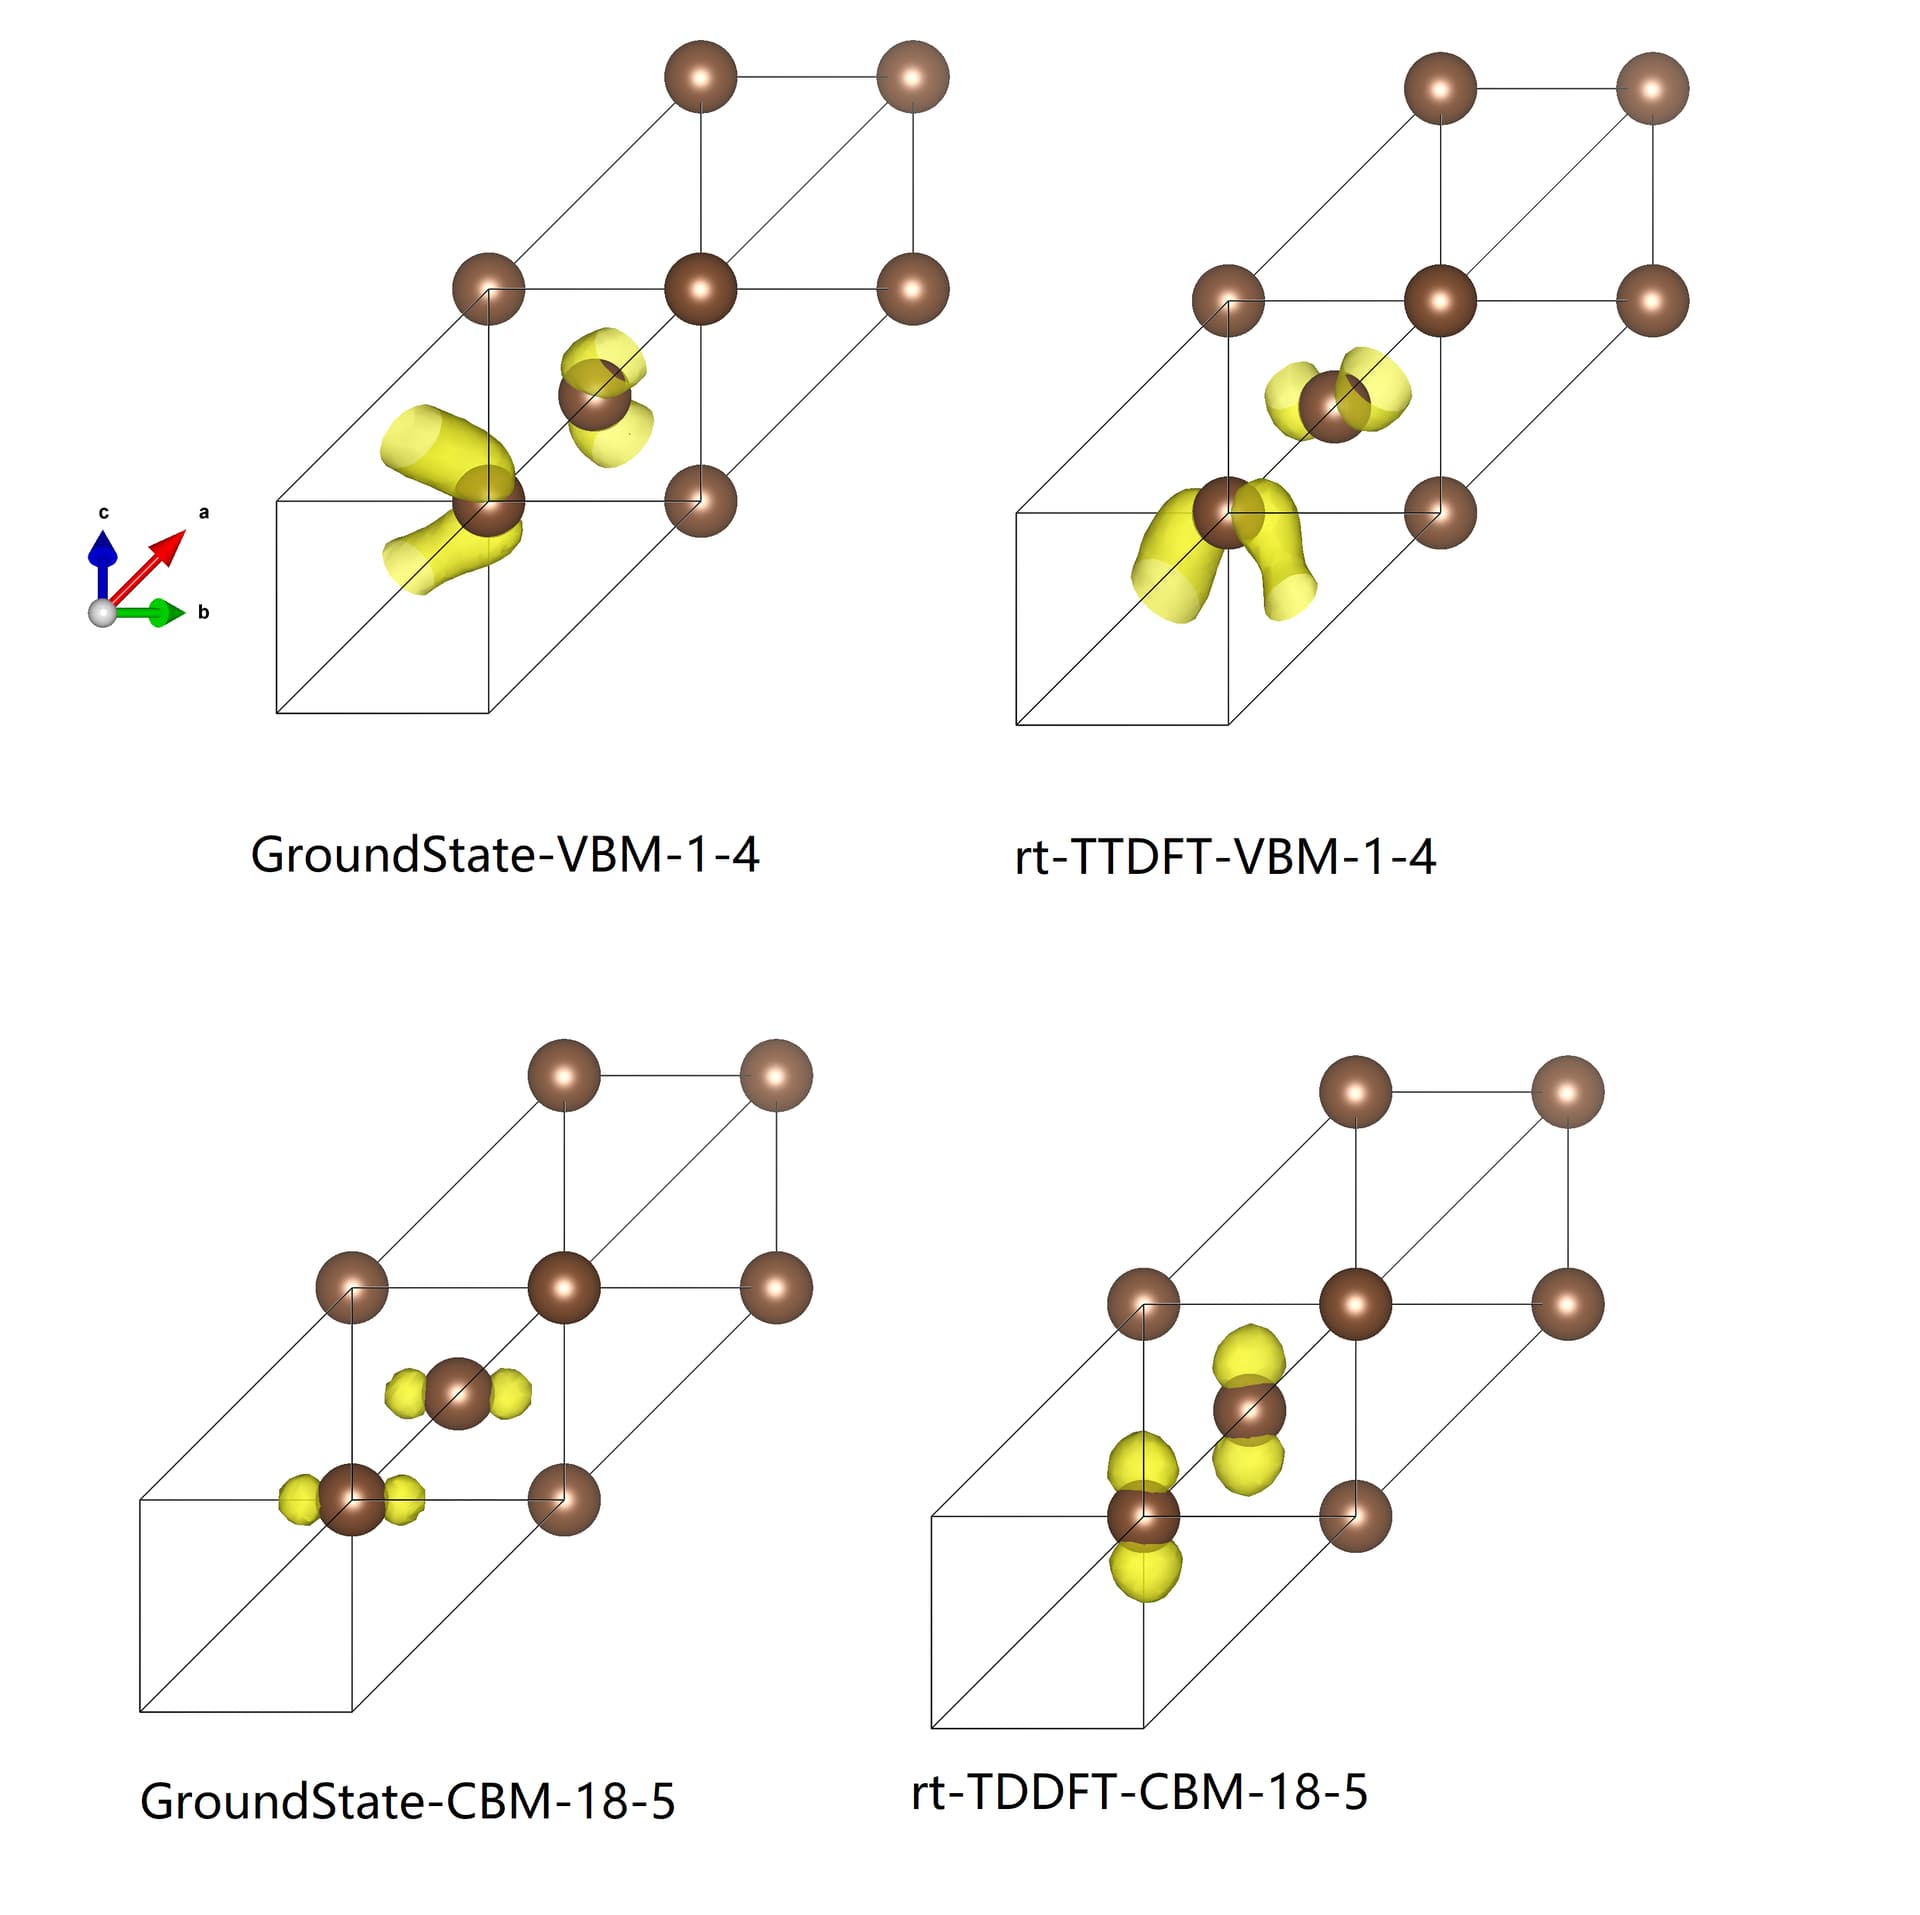
I did as you said, and it’s really working. I got the wavefunction from the renamed STATE.OUT file.
The labels 1 and 4, 18 and 5 identify the KS state, it seems like this,