Dear community,
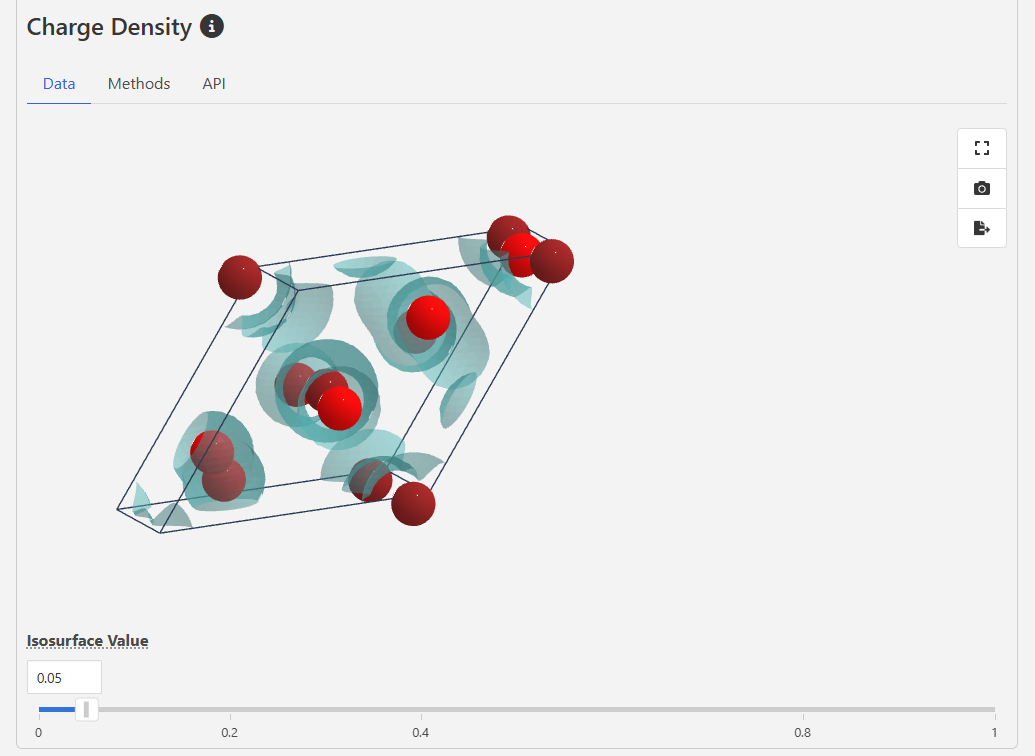
I am currently working with charge density data from the Materials Project database. I’ve discovered that the crystal toolkit library is used for the visualization of materials, and I was able to obtain a similar visualization following the instructions in the crystal toolkit document. However, I am now encountering difficulties in visualizing (the isosurface of) charge density as shown below. I believe that it is also based on crystal toolkit library (perhaps volumetric object…?), but could not find description for it elsewhere. Can anyone help me with this?
Best,
Junkil Park