Hello users
I am using the lammps Stable version (3 Mar 2020) version ,and my simulation system is attached with this email.For which I want to know the water clustering effect in my system and The cut off radius rc is usually chosen to be the first local minimum of corresponding RDF(0-0)is 0.35nm.I want to plot Size distributions of water cluster at various water mole fractions for which i want my the cluster size in my x-axis and mole fraction of water in my y-axis.Can it will be possible using the following command:
compute cluster water cluster/atom 3.5
compute cc1 water chunk/atom c_cluster compress yes
compute size water property/chunk cc1 count
fix 18 water ave/histo 1000 1 1000 0 30 50 c_size mode vector ave one beyond ignore file test1.histo
actually I am not able to predict anything from the output file can anyone help??i m attaching my output file,also I have one question regarding the selection of lo/hi bounds within which to histogram
the format of the file is documented in the documentation of the fix. the file also has comments at the top which give a quick summary which should sufficient to make sense of the data.
from your specific file it says:
- you have the histogram output at time step 15000000
- you have histogrammed your cluster sizes into 50 bins
- you have 43 data items that fit into the histogram and none that did not fit
- the smallest item had a value of 3 the largest a value of 12
- the values given for the individual bins are always the center of the bin. (please note there is no point in using 50 bins for a range of values between 0 and 30 if those values must be integer) so for your specific system, it would be most convenient to have bins starting at N-0.5 and ending at N+0.5.
- you have 4 cluster sizes in your system, 36x 3, 4x 6, 1x 9 and 2x 12
some comments:
- you need to adjust your settings for the histogram, as you have too many bins.
- you probably want to take more samples than just one frame to compute the histogram from. but keep in mind that forming/breaking clusters is a small process, so there is no point in doing the analysis too often (and thus waste time).
ANSWER:thanks for your reply sir.For my system I can I select the VALUES for Number-of-bins? Total-counts? Missing-counts? Min-value? Max-value?
test1.histo (763 Bytes)
ANSWER:thanks for your reply sir.For my system I can I select the VALUES for Number-of-bins? Total-counts? Missing-counts? Min-value? Max-value?
obviously not all of those as most are properties of your system. what you can choose is documented in the LAMMPS manual. you have to carefully study the documentation of the fix ave/histo command. it explains all available options and choices in detail.
axel.
thanks for the clarification.without using the fix ave/histo command can I get the cluster size using ave/time.My aim is to get the cluster size.
fix 13 water ave/time 100 1 100 c_size[*] file com.out mode vector
there is no such thing a the cluster size as your histogram data clearly shows. and your histogram was only for a single snapshot. in a dynamical system, the individual cluster sizes are very likely to change over time. so would need to collect a sufficiently large number of samples to get statistically converged data.
to construct the graph you are looking for you have to do multiple simulations at different mole fractions anyway, and for each mole fraction you can obtain a histogram. from post processing each histogram, you can compute either the average cluster size or the most likely cluster size or median cluster size or whatever else is the property you want to use and then plot it against the mole fraction, which is an input parameter of a simulation.
there is no magical command in LAMMPS that can do that kind of (standard scientific) procedure for you.
axel.
Thanks for the detailed explanation sir
Hello users
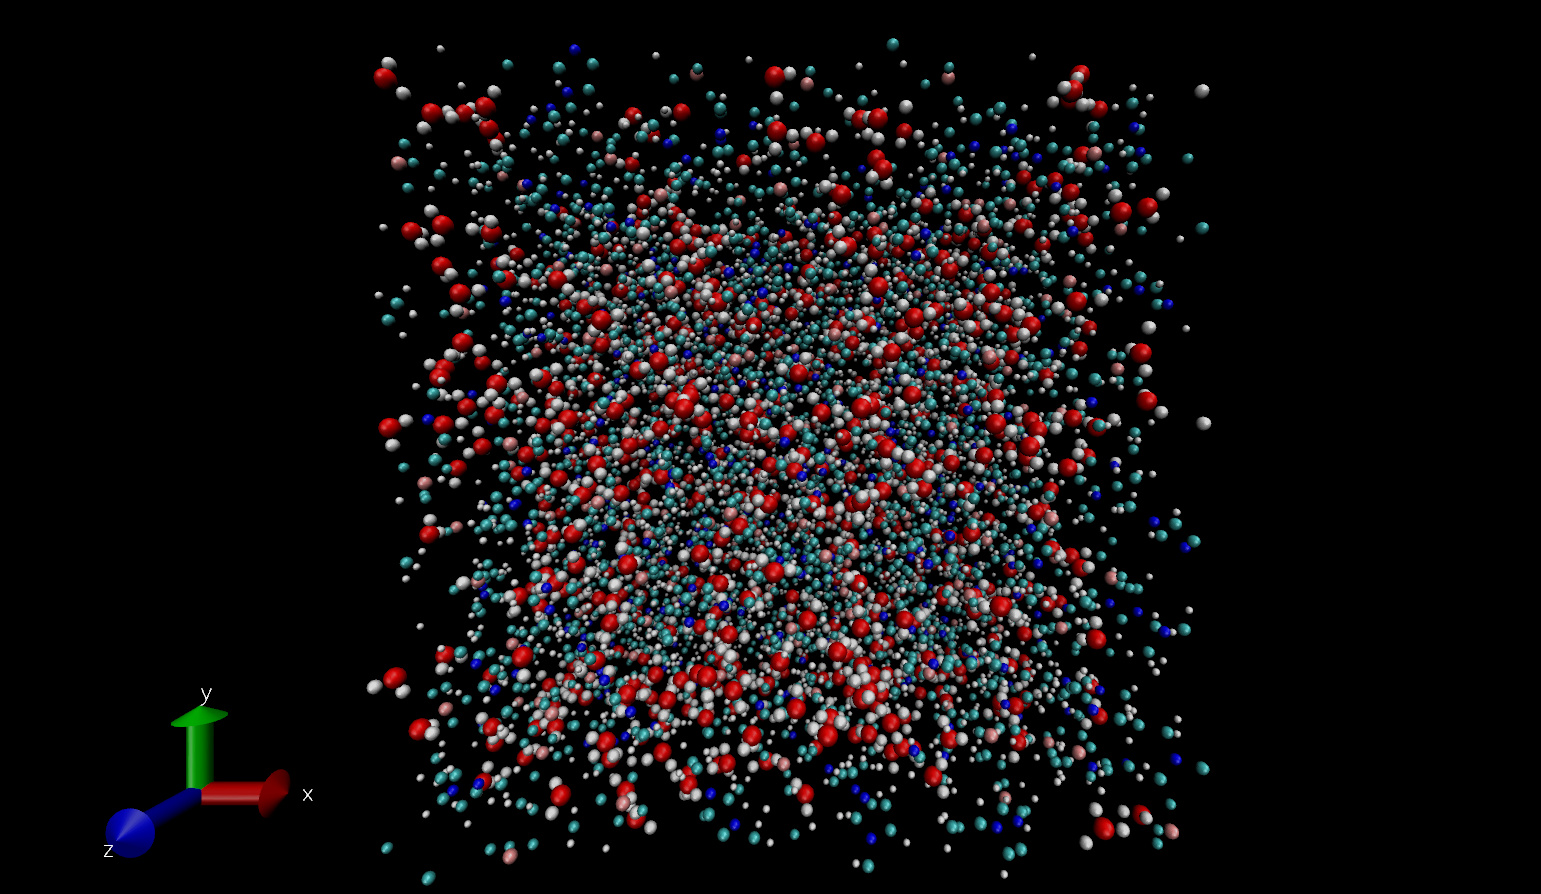
I am using the lammps Stable version (3 Mar 2020) version, and my simulation system is attached to this email. (which is basically a droplet on the surface containing water molecules). For which I want to know the water clustering effect in my system . (Size distributions of water cluster at various water mole fractions )
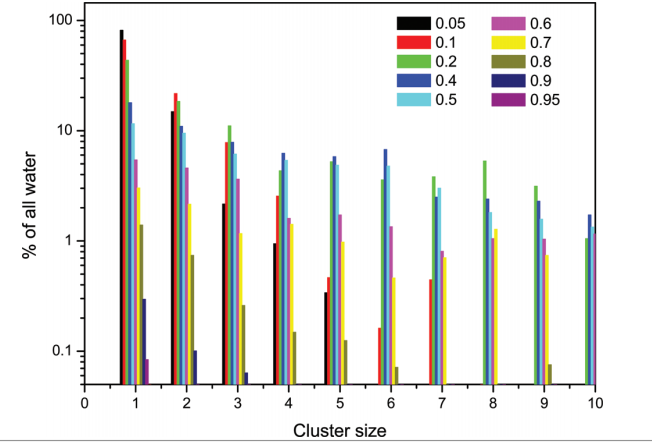
The cut off radius rc is usually chosen to be the first local minimum of corresponding RDF(0-0)is 0.35nm. I want to plot Size distributions of water cluster at various water mole fractions and using the rerun command where there have been 1000 frames in my dump.lammpstrj file. I have used the following commands to get the cluster size which in the literature is showing from 0-10. However, my output file is showing high value.[3.5*7] .Is anything wrong I am doing??
Thanks
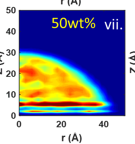
literature picture
compute cluster water cluster/atom 3.5
compute cc1 water chunk/atom c_cluster compress yes
compute size water property/chunk cc1 count
fix 18 water ave/histo 1000 1 1000 0 50 50 c_size mode vector ave one beyond ignore file test1.histo
rerun dump.lammpstrj dump x y z
50.dat (448 KB)
Hello users
I am using the lammps Stable version (3 Mar 2020) version, and my simulation system is attached to this email. (which is basically a droplet on the surface containing water molecules). For which I want to know the water clustering effect in my system . (Size distributions of water cluster at various water mole fractions )
The cut off radius rc is usually chosen to be the first local minimum of corresponding RDF(0-0)is 0.35nm. I want to plot Size distributions of water cluster at various water mole fractions and using the rerun command where there have been 1000 frames in my dump.lammpstrj file. I have used the following commands to get the cluster size which in the literature is showing from 0-10. However, my output file is showing high value.[3.5*7] .Is anything wrong I am doing??
it is impossible to make any serious comments with such limited information.
there are many possible sources of error that we cannot tell from remote. you need help from somebody literally looking over your shoulder and knowing in depth the details of your simulations and how well they reproduce basic properties of the model you are using.
there can be incorrect potential parameters, bad choice of initial geometries, incorrect simulation settings, insufficient equilibration, typos, mistakes in the post-processing.
also, without knowing more details about the literature figure, it is extremely difficult to understand what it means and how it compares to the plot you have produced.
in general, it is unlikely that somebody will debug your simulations for you if you don’t get the expected results. figuring things out and particularly how to avoid mistakes or how to correctly interpret data is part of the research process.
axel.