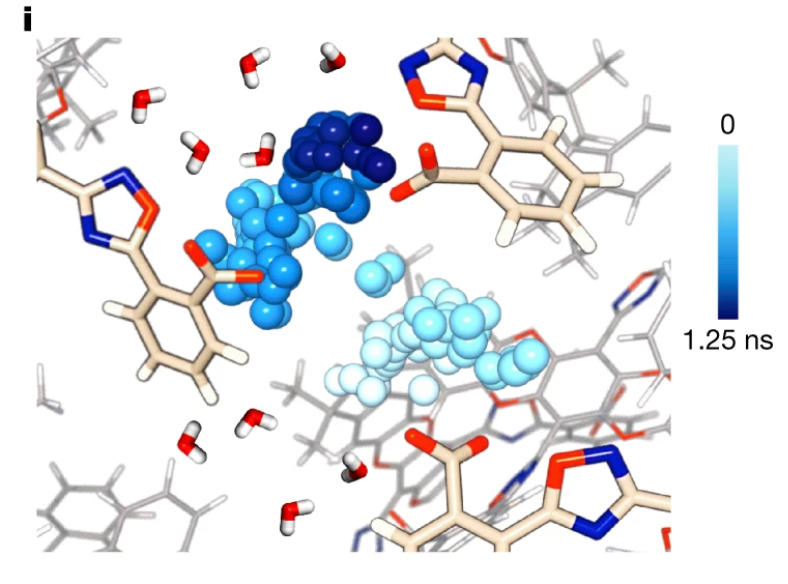
I would like to build a view that shows the trajectory of the specific atoms while the rest atoms are kept frozen. The view should look like the following screenshot. Only the selected atom displays its trajectory, and the atom trajectory is colour-coded by the evolution of time.
I have a data file and a trajectory file. I also have a pro licence. I can probably tell the figure was rendered from Ovito Pro based on the texture and style. I would really appreciate it if someone could give some suggestions on how to realise it.
My guess is that this image was not created with OVITO but with another visualization application. But we can try to do something similar with OVITO.
There is a Generate Trajectory Lines function in OVITO that draws a line behind the selected moving atoms to visualize their trajectories. The lines can be colored to visualize time, for example. This is different from your picture, but perhaps also suitable? Here an example from the documentation:
If you really want to display snapshots of the atoms sampled at different simulation times, then this is impossible with OVITO Basic, I’m afraid. Since there is no built-in function for this, we have to write a custom function in Python, which requires OVITO Pro. Let me know if you want me to give you more details.