I have what is probably a silly question about the colour coding modifier. I am using it to begin the analysis of my LAMMPS trajectory files by colour coding the potential energy per atom and entropy per atom. There is one thing that has caused some confusion in both myself and my supervisor. By default, when you bin a region of a histogram to then analyze with the colour coder, atoms that don’t belong to that range take on the respective extremes of the colour map. Is there any way that I can remove the colour of atoms outside of the regions I am binning?
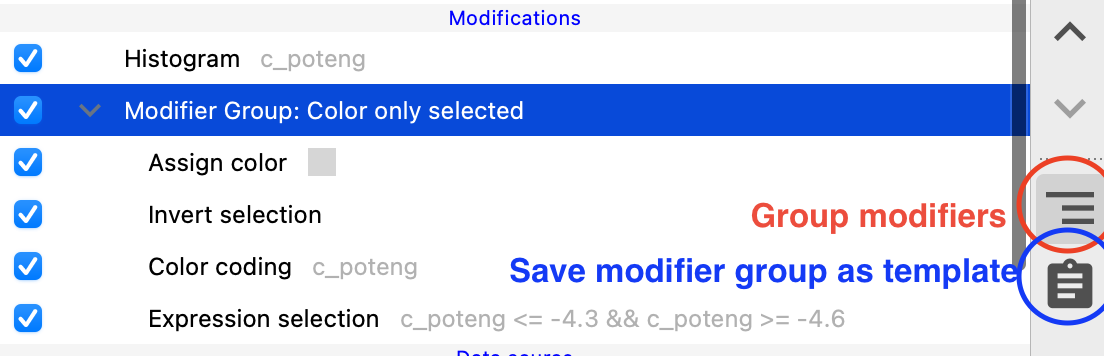
One way to achieve this is by building the following pipeline (also shown in the attached screenshot):
- First, create a particle selection of those particles that have potential energy values within the desired range, for example, using an Expression Selection Modifier.
- Then, use the Color Coding modifier with the options “Color only selected elements” and “Keep selection”. This way, non-selected atoms retain their original color.
- Now, you can invert the particle selection.
- If needed, you can assign a color outside of the color coding color map to the other atoms, such as gray.

If you often use this feature, you can group this sequence of modifiers and save it as a template in your OVITO Basic installation. More on this here: Modifier templates — OVITO User Manual 3.10.5 documentation
1 Like

This is very helpful, thank you for your response! I’m not sure how/why I missed the expression selection, but using something like that is exactly what I need
1 Like
By the way, OVITO’s Histogram modifier is another suitable tool for selecting particles within a given property range (see its “create selection” option). That’s just in case you prefer a GUI over entering the range in the form of a math expression.
2 Likes
Oh I see, that will also be useful. I think there is value to use both methods depending on what exactly I am looking at. For context, all of my LAMMPS trajectory data contains information about a phase change in ice and in liquid water. In the case of regular ice, the method you described will probably be easier since it is just the GUI interface and I just need to enter numbers by the look of it. While in my liquid water data, having the AND operator will be really nice to focus on a couple regions of my histograms simultaneously