Dear all,
1- I have simulated a system cylindrical shape with 9.8 (nm) constant length , I am confused about using chunk/atom bin/cylinder for calculation properties in each bins . I wrote these commands cylindrical regions which it is illustrated in attached file.
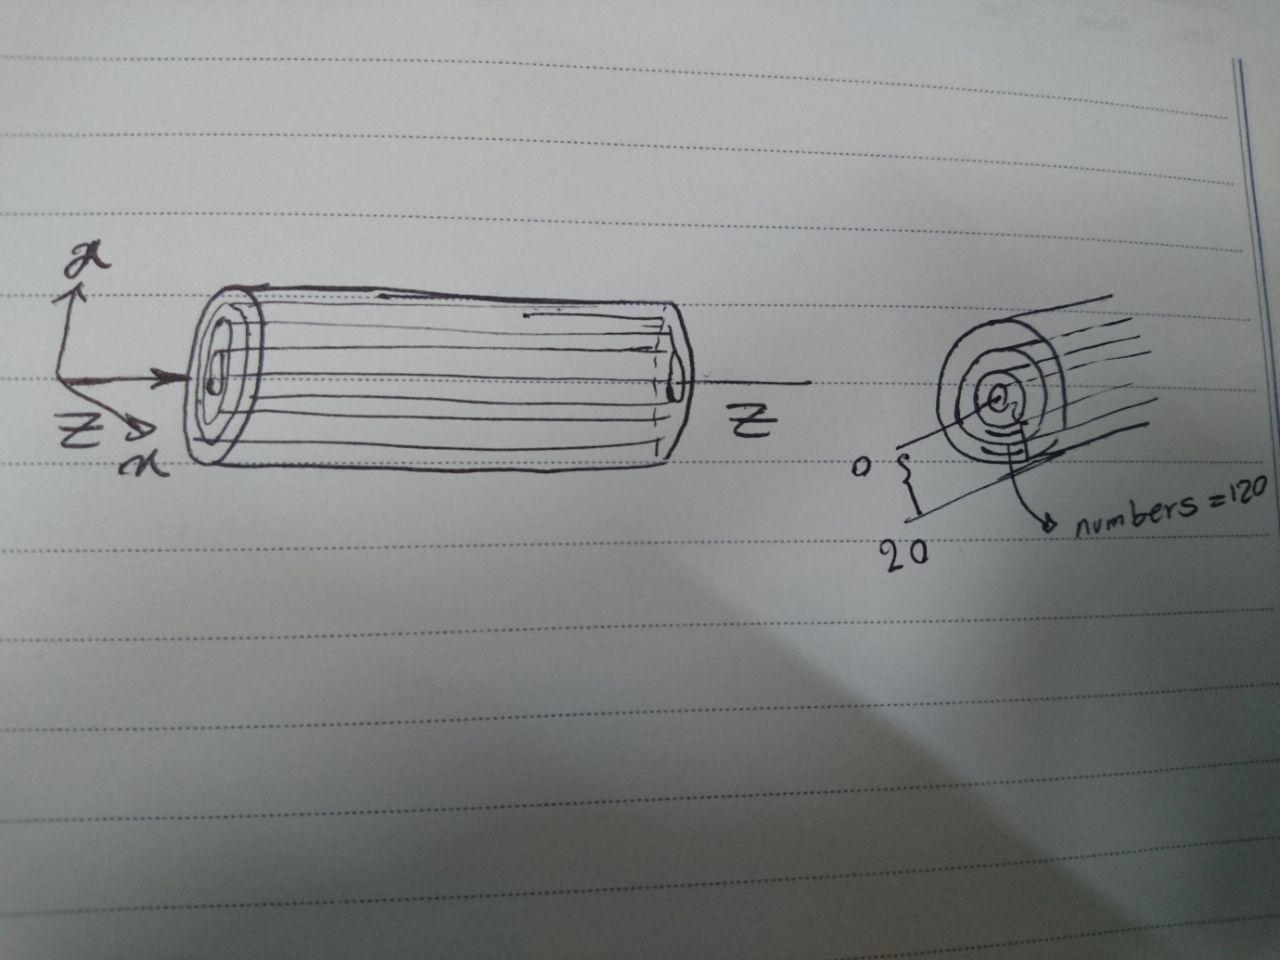
compute dens oxy chunk/atom bin/cylinder z center 98 100 100 0 20 120
fix avechunk oxy ave/chunk 500 1 500 dens density/number density/mass temp file densmass1.profile
dim = z = axis of cylinder axis
origin = center ???
delta = 98 = thickness of spatial bins in dim
c1,c2 = 100 100 =coords of cylinder axis in other 2 dimensions (distance units)
crmin,crmax =0 20 = bin from cylinder radius rmin to rmax (distance units)
ncbin = 120 =number of concentric circle bins between rmin and rmax
is it correct?!
2- output densmass1.profile by default
Chunk-averaged data for fix ID and group name
Timestep Number-of-chunks
Chunk (OrigID) (Coord1) (Coord2) (Coord3) Ncount value1 value2 …
for plotting diagrams I have to choose one snapshot from densmass1.profile, (for instance: the last ones )
is it possible plot all data in one diagrams which are extracted from densmass1.profile?!!!
Regards
Zohreh
Dear all,
1- I have simulated a system cylindrical shape with 9.8 (nm) constant
length , I am confused about using chunk/atom bin/cylinder for calculation
properties in each bins . I wrote these commands cylindrical regions which
it is illustrated in attached file.
compute dens oxy chunk/atom bin/cylinder z center 98 100 100 0 20 120
fix avechunk oxy ave/chunk 500 1 500 dens density/number density/mass temp
file densmass1.profile
dim = z = axis of cylinder axis
origin = center !!!!!!!??
delta = 98 = thickness of spatial bins in dim
c1,c2 = 100 100 =coords of cylinder axis in other 2 dimensions (distance
units)
crmin,crmax =0 20 = bin from cylinder radius rmin to rmax (distance units)
ncbin = 120 =number of concentric circle bins between rmin and rmax
is it correct?!
please note, that this mailing list is not an "input file approval
service". if you want to find out, whether your commands do what you want
them to do, then apply the scientific method and construct (simple) tests
and verify, that you get the expected results.
2- output densmass1.profile by default
# Chunk-averaged data for fix ID and group name
# Timestep Number-of-chunks
# Chunk (OrigID) (Coord1) (Coord2) (Coord3) Ncount value1 value2 ...
for plotting diagrams I have to choose one snapshot from densmass1.profile,
(for instance: the last ones )
is it possible plot all data in one diagrams which are extracted from
densmass1.profile?!!!
this depends on the program you use for plotting and how you enter the
data into it. if at all, this would be a question for the forum/mailing
list of that plotting tool.
axel.