Thank you once again for your kind and valuable support.
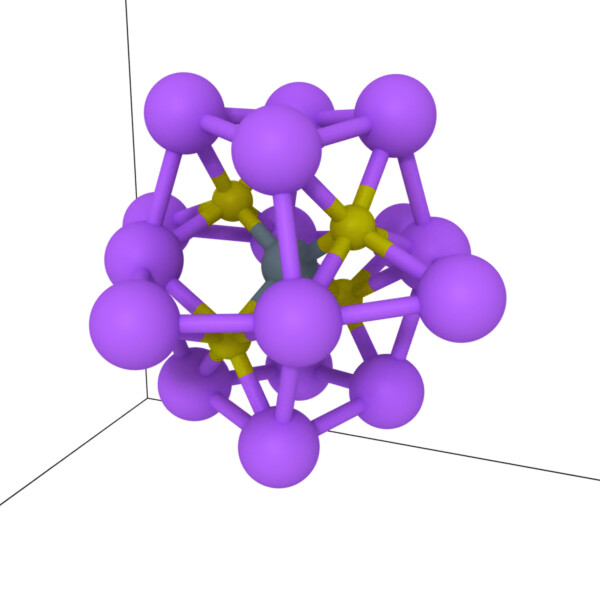
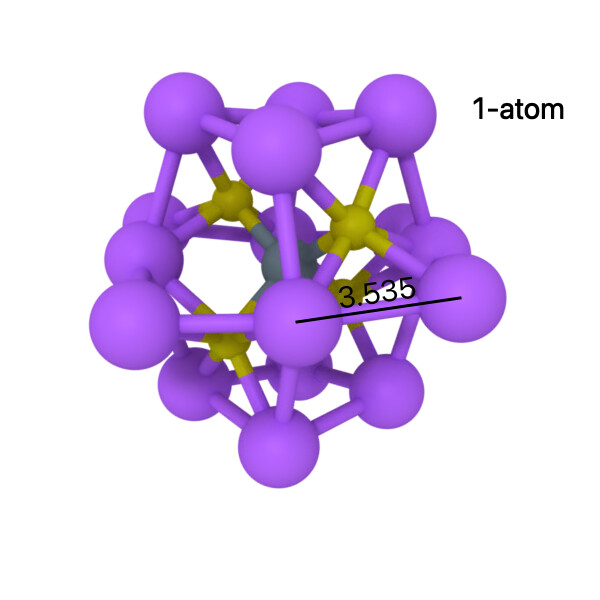
I have a follow-up question related to atomic clustering. Could you please take a look at the image I’ve included below? I would like to understand how to reproduce this type of visualization and analysis using OVITO or its Python scripting interface.
As I am still a beginner with OVITO, I would greatly appreciate any clear explanation, step-by-step guidance, or example scripts that could help me achieve a similar result. If possible, visual illustrations or screenshots for each step would be especially helpful.
Thank you very much for your time and continued support.
abdo
Thank you, Daniel, for your explanation. I will try this approach and see how it works.
I really appreciate your time and the detailed guidance you provided in advance.
Thanks again for explaining it so clearly.