Good day, I have tried to use the MP API to generate my own Pourbaix diagrams locally, and I seem to notice from large differences between the API and the website.
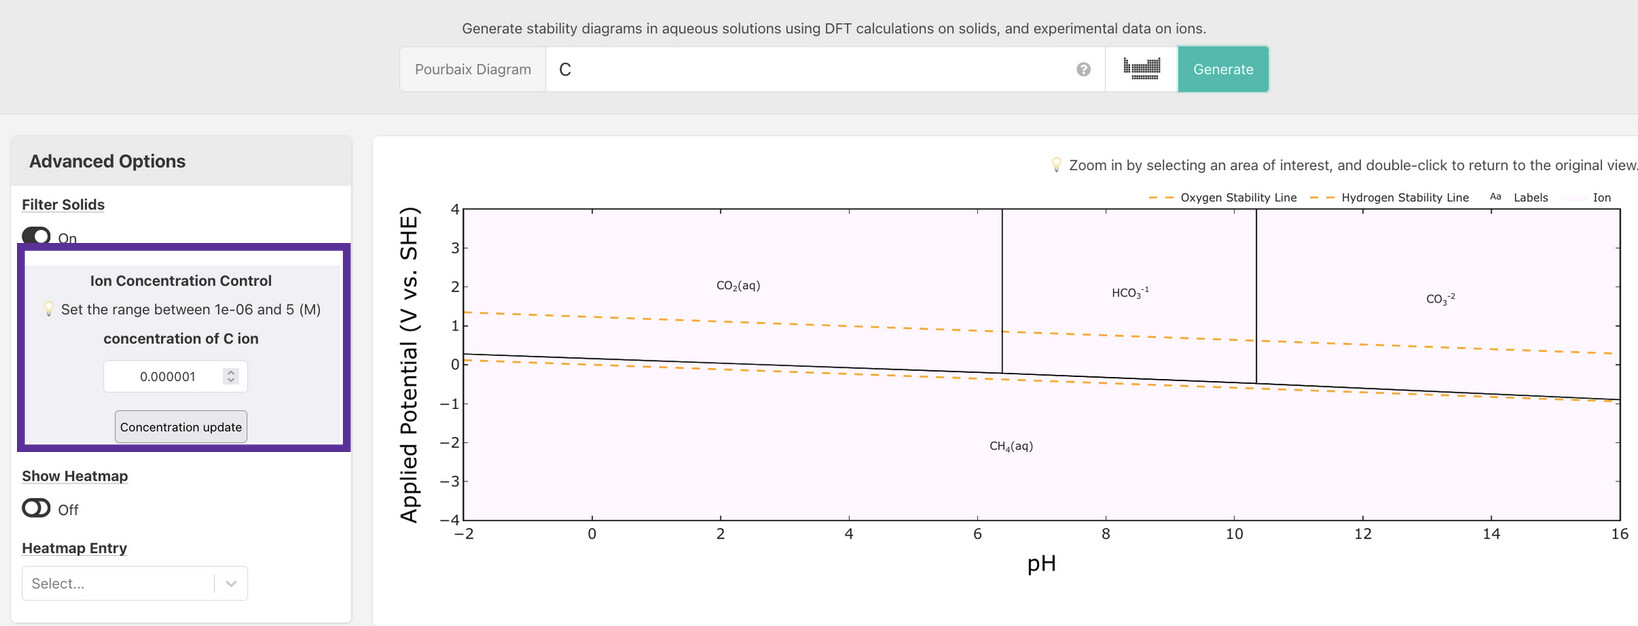
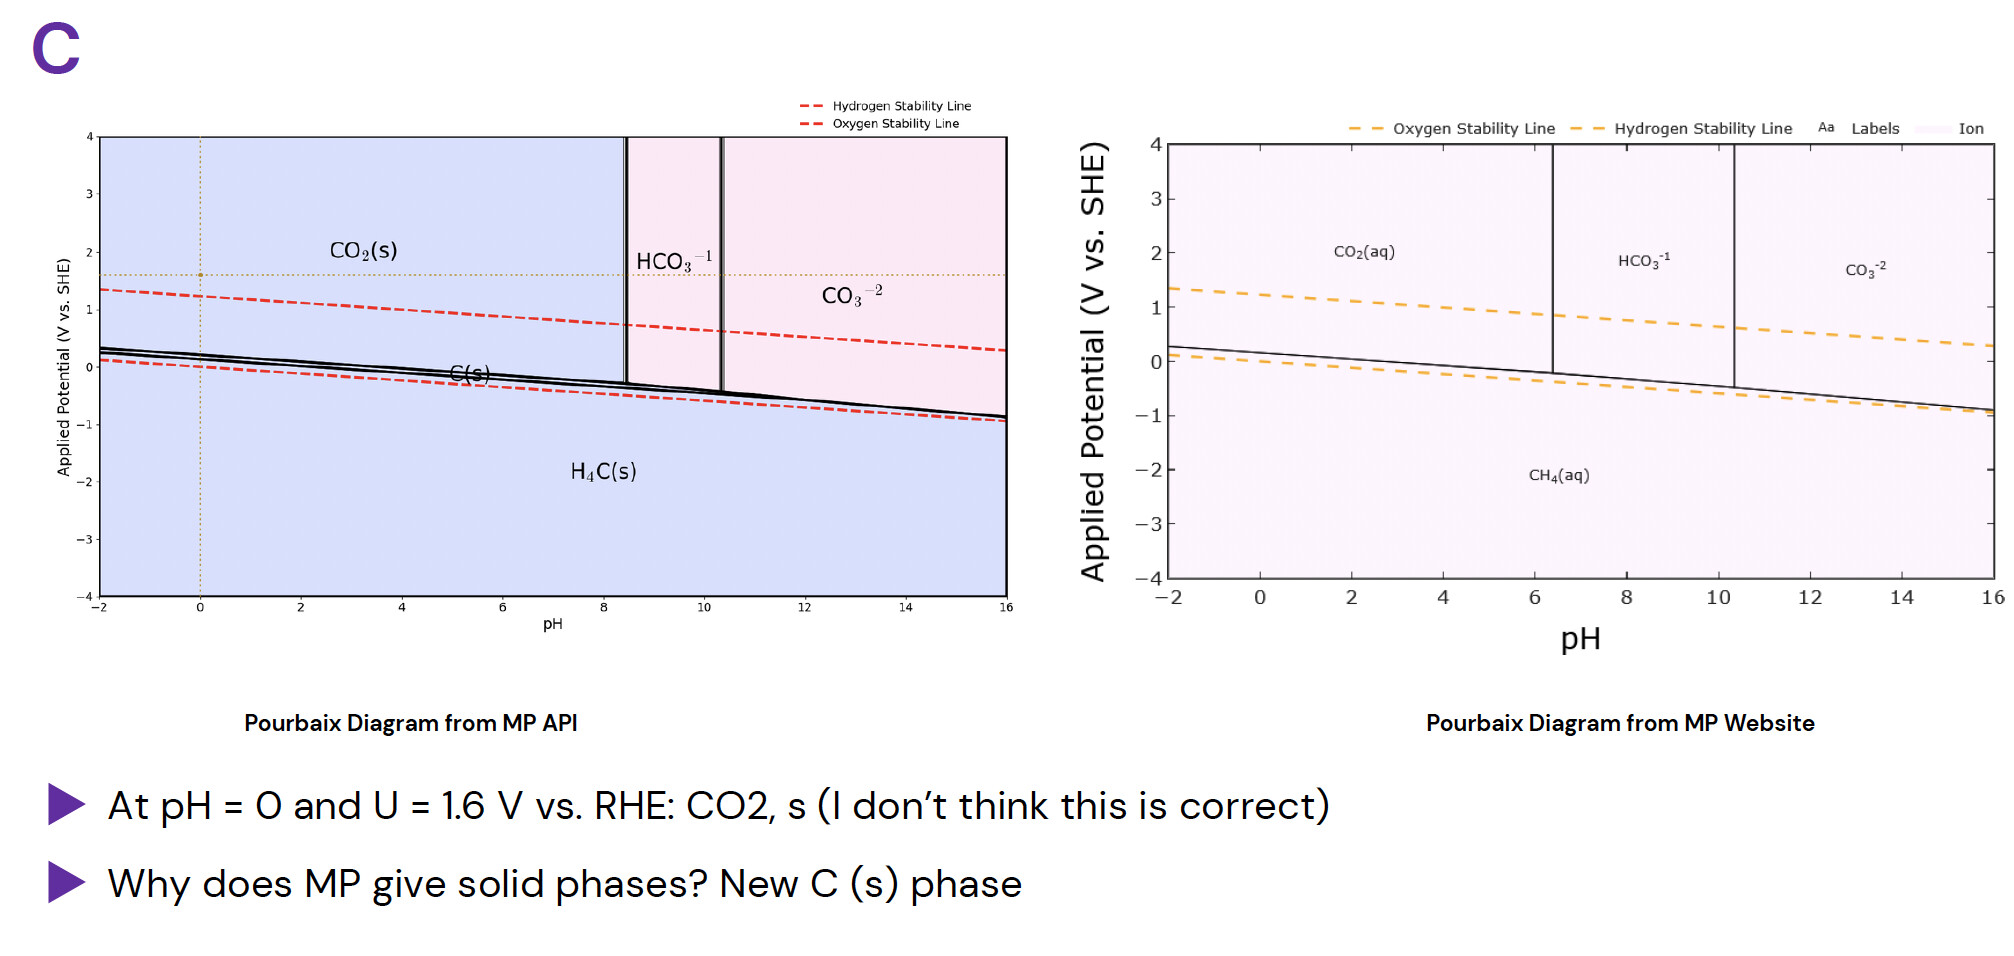
There are some diagrams with clearly mistaken phases, such as CO2 from Carbon’s Pourbaix Diagram:
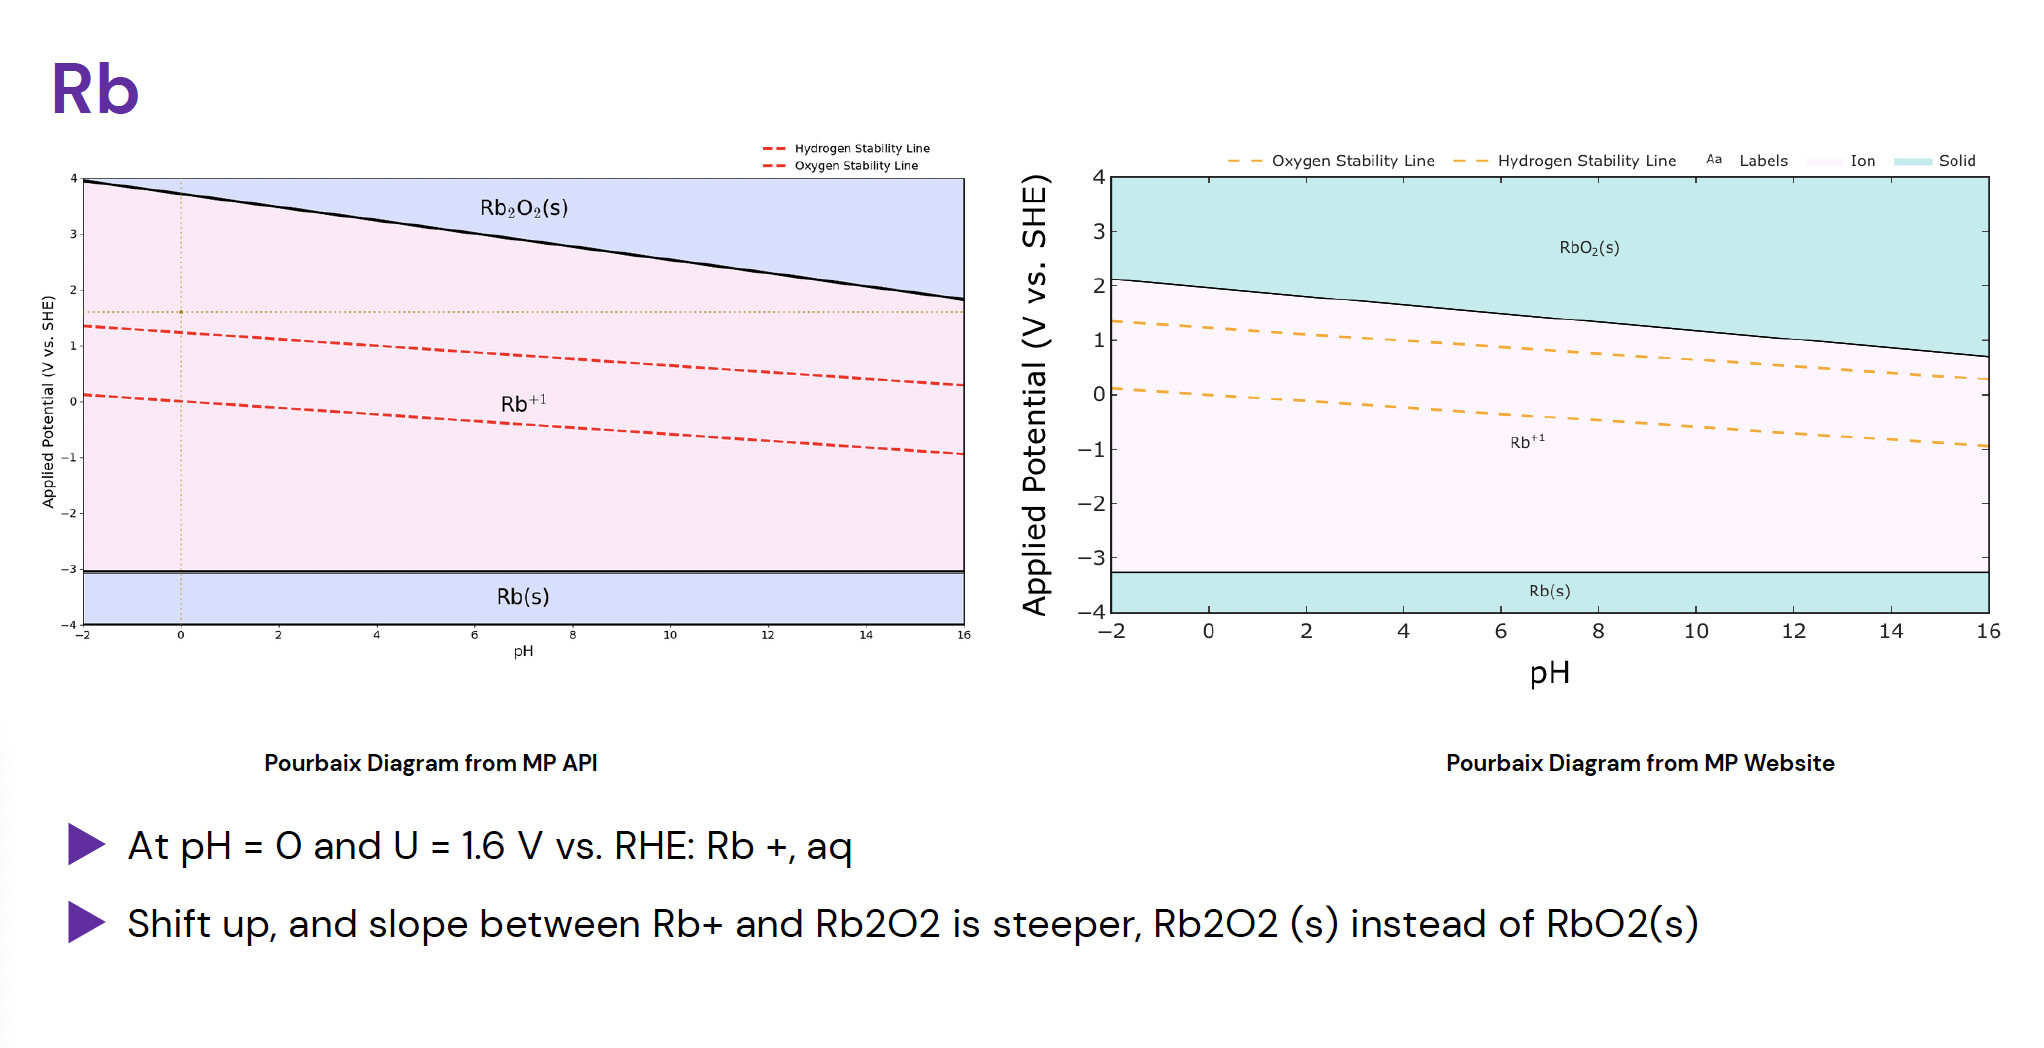
There are some patterned errors, particularly in Group 1A or 2A elements, where a different oxide is shown:
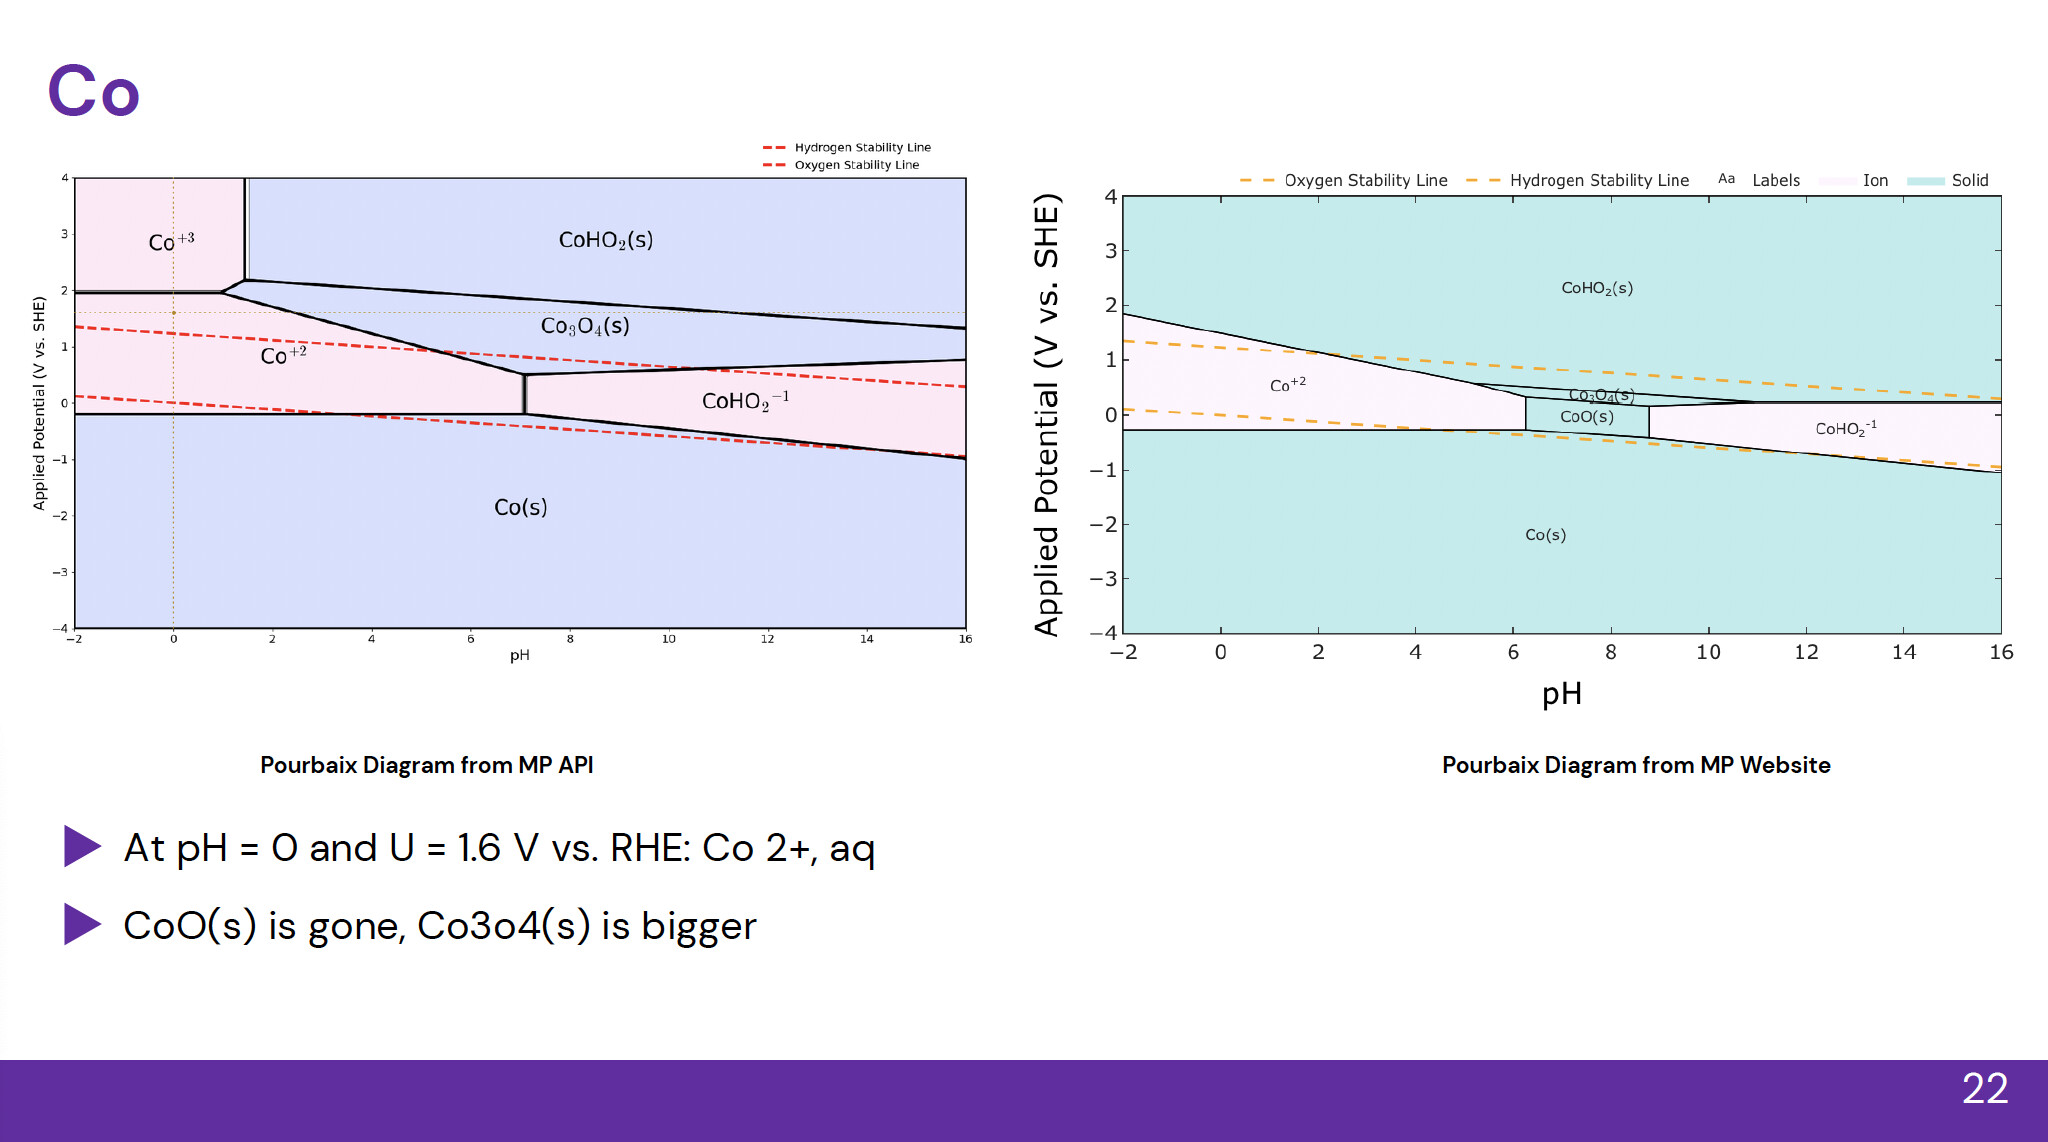
In other cases, phase sizes are vastly different:
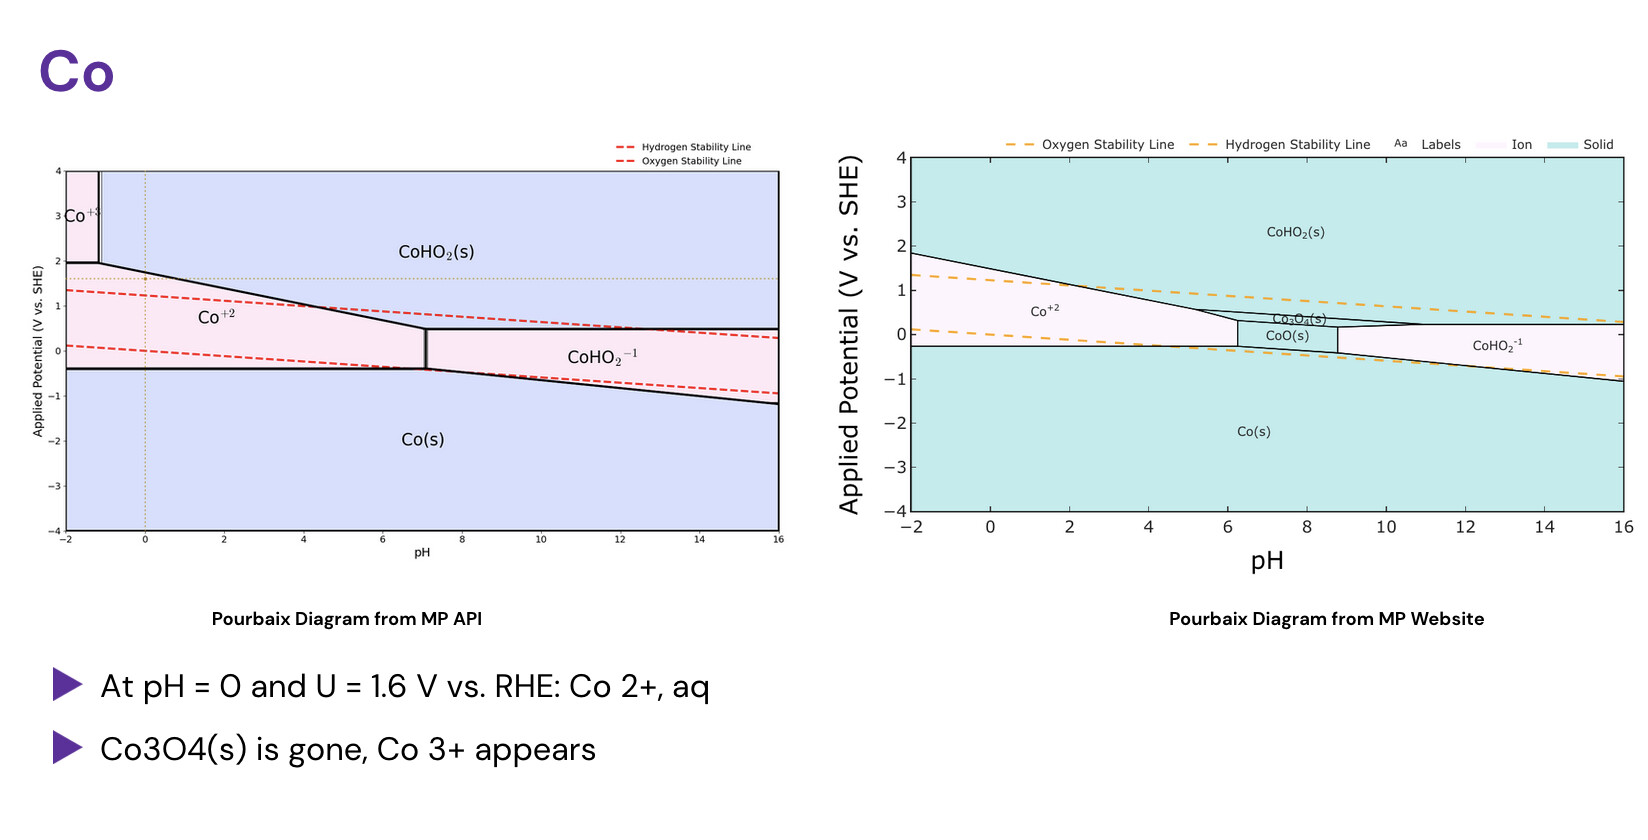
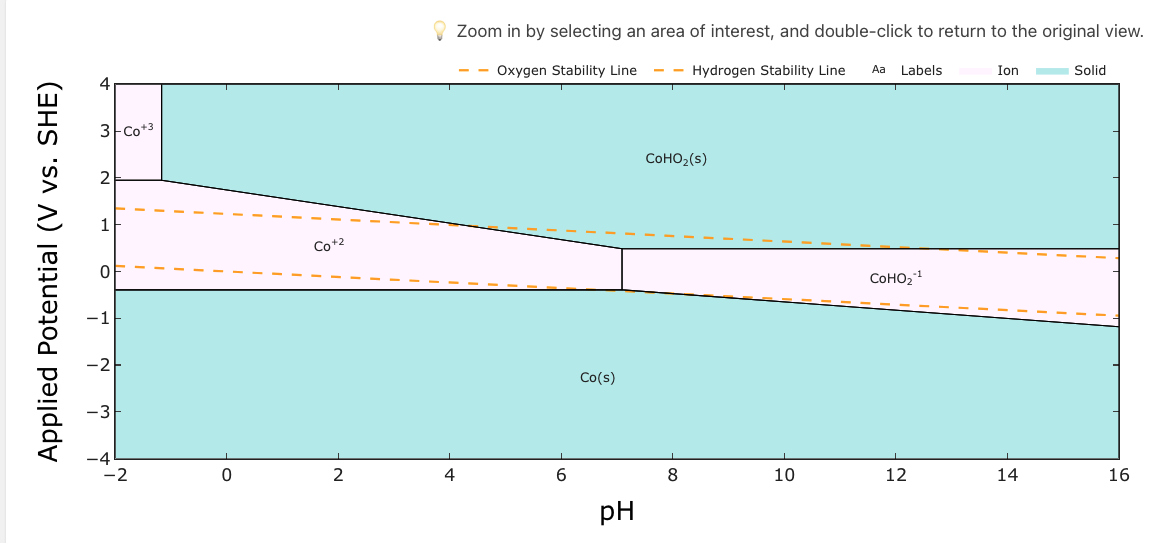
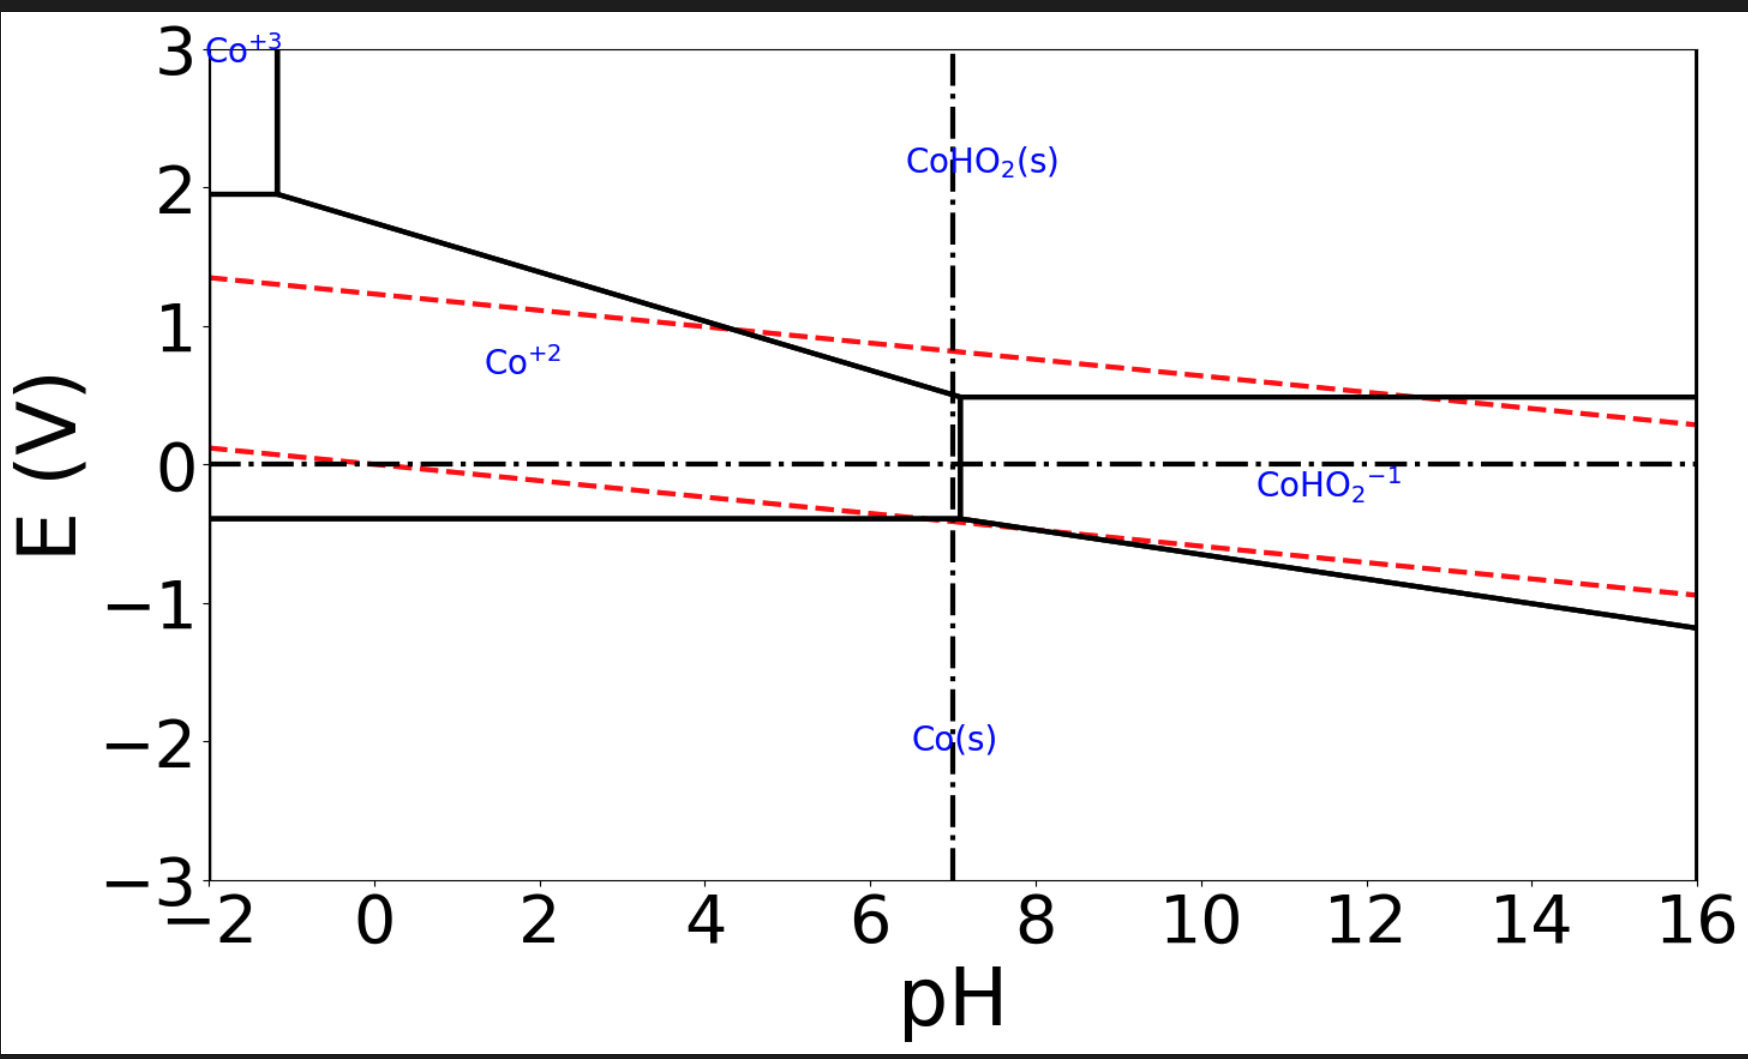
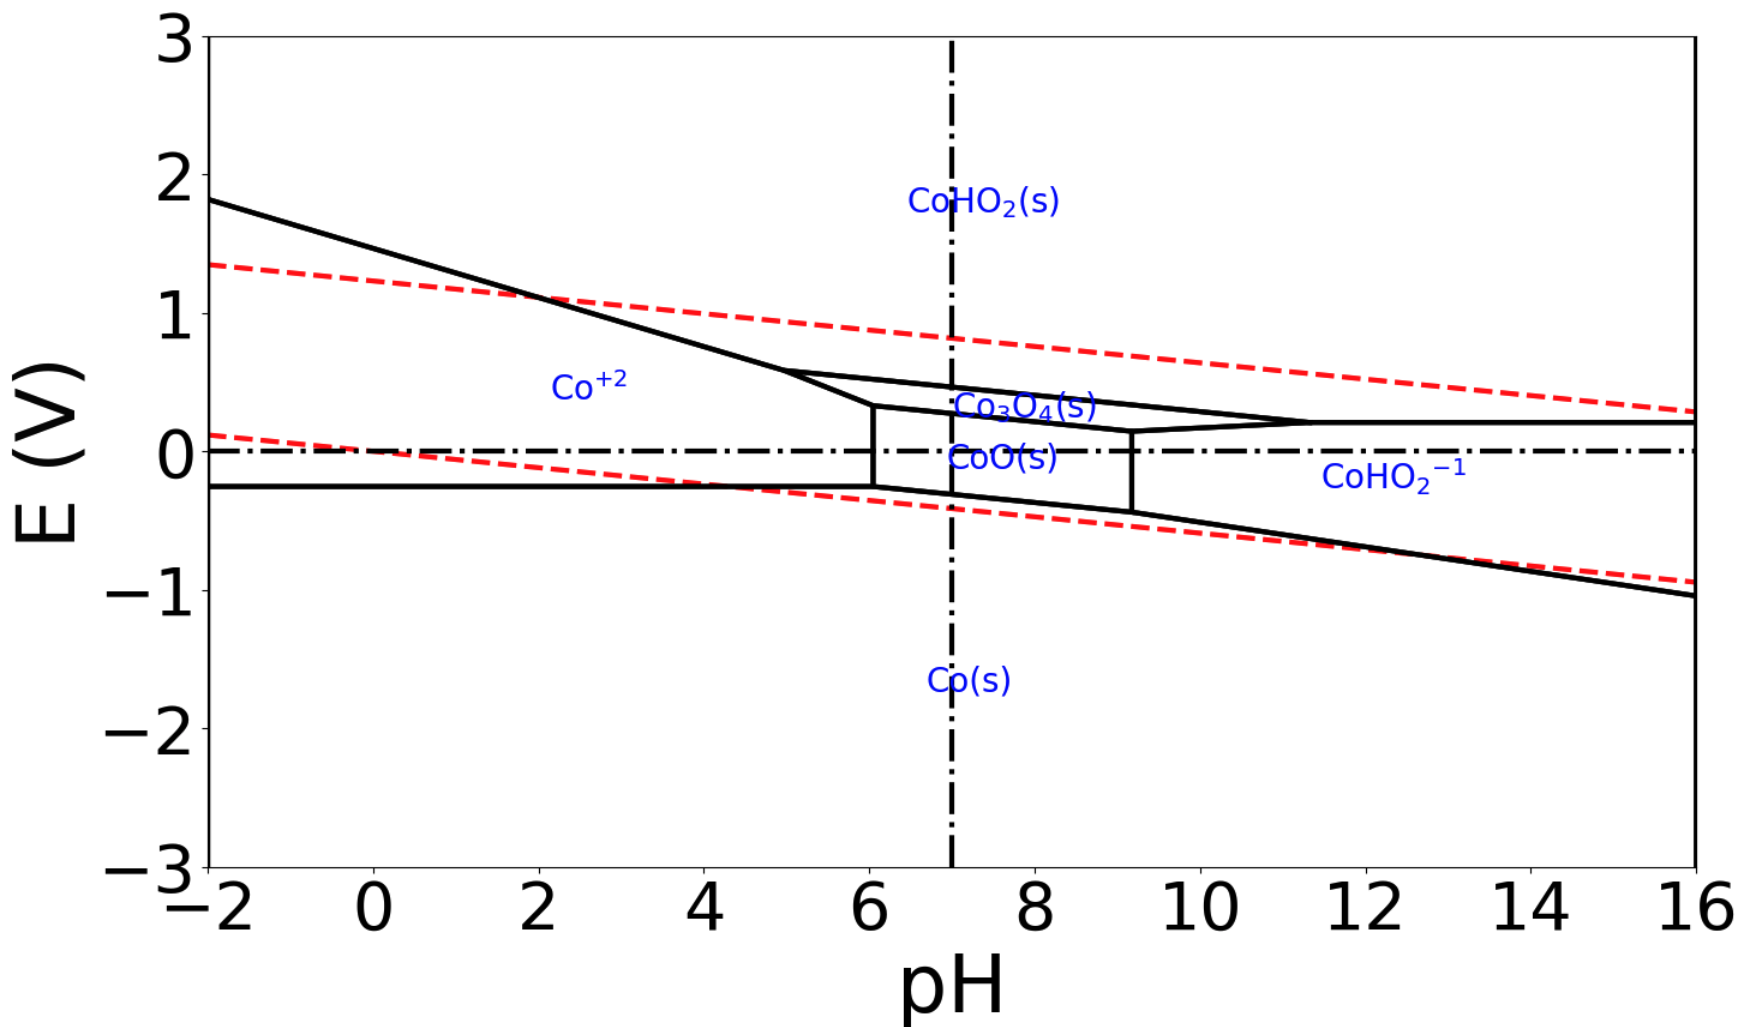
Other times, new phases appear or disappear:

Please see the code below (conducted for all elements except S, Cr, Se, Ag - for a different discussion)
from mp_api.client import MPRester
import matplotlib.pyplot as plt
import numpy as np
from collections.abc import Iterable
from matplotlib import rcParams
from matplotlib import pyplot as plt
from pymatgen.analysis.pourbaix_diagram import PourbaixDiagram, PourbaixPlotter, PourbaixEntry, MultiEntry
from matplotlib.patches import Polygon
from scipy.spatial import ConvexHulldef _is_constant(vals, tol=1e-9):
True if all values equal to a constant within tolerance
return np.nanmax(vals) - np.nanmin(vals) < tol
def remove_default_guides(ax, ph_target=7.0, v_target=0.0, tol=1e-6):
“”“Remove the vertical pH=ph_target and horizontal V=v_target lines
that PourbaixPlotter draws by default.”“”
to_remove =
for ln in ax.get_lines():
x = np.array(ln.get_xdata(), dtype=float)
y = np.array(ln.get_ydata(), dtype=float)# Identify a vertical line at pH ≈ ph_target if _is_constant(x) and np.isfinite(x).all(): if np.isclose(x[0], ph_target, atol=tol): to_remove.append(ln) continue # Identify a horizontal line at V ≈ v_target if _is_constant(y) and np.isfinite(y).all(): if np.isclose(y[0], v_target, atol=tol): to_remove.append(ln) continue # Remove the matched lines for ln in to_remove: ln.remove()-------------------------------
GLOBAL FONT: SERIF
-------------------------------
rcParams[“font.family”] = “sans-serif”
rcParams[“mathtext.fontset”] = “cm” # computer modern math look-------------------------------
Get MPR API Key and Select Element
-------------------------------
#el_list = [“Li”, “Be”, “B”, “C”, “N”, “F”, “Na”, “Mg”, “Al”, “Si”, “P”, “Si”, “Cl”, “K”, “Ca”, “Sc”, “Ti”, “V”, “Cr”, “Mn”, “Fe”, “Co”, “Ni”, “Cu”, “Zn”, “Ga”, “Ge”, “As”, “Se”, “Br”]
el_list = [“C”]for element in el_list:
with MPRester() as mpr:
    # 'Fe' is the element of interest; O and H are added automatically
    pbx_entries = mpr.get_pourbaix_entries(element, use_gibbs=300)

print(f"Number of Pourbaix entries: {len(pbx_entries)}")

# -------------------------------
# CREATE DIAGRAM & BASE PLOT
# -------------------------------
pbx = PourbaixDiagram(pbx_entries)
plotter = PourbaixPlotter(pbx)


#fig, ax = plt.subplots(figsize=(10, 6))
ax = plotter.get_pourbaix_plot(
    limits=((-2, 16), (-4, 4)),
)

# Now retrieve the figure that the plotter actually created
fig = ax.figure

# -------------------------------
# Auto font scaling based on size
# -------------------------------
base_width = 12
scale = fig.get_figwidth() / base_width

# ------------------------------------------------------
# STEP 0 — Reference lines: pH=0 (vertical) and E=1.6 V vs RHE (horizontal)
# ------------------------------------------------------

# Dark yellow (choose a readable, print-safe tone)
dark_yellow = "#b8860b"   # DarkGoldenRod

# A fine dashed pattern (short dashes)
fine_dash = (0, (2, 3))   # on=2pt, off=3pt

# Create the two guide lines (no legend entries)
ph0_line = ax.axvline(
    0.0, color=dark_yellow, linestyle=fine_dash, linewidth=1.2,
    zorder=4, label="_nolegend_"
)
E16_line = ax.axhline(
    1.6, color=dark_yellow, linestyle=fine_dash, linewidth=1.2,
    zorder=4, label="_nolegend_"
)

# Intersection marker at (pH=0, E=1.6 V vs RHE)
# Use a small solid circle; we'll make it responsive too.
pt_line = ax.plot(
    [0.0], [1.6], "o",
    color=dark_yellow, markerfacecolor=dark_yellow,
    markersize=4.0, zorder=5
)[0]

# --- Register originals so the resize callback can scale them ---
# (Do this once, right after creating the artists.)
if not hasattr(ax, "_resp_lines_extra"):
    ax._resp_lines_extra = []
if not hasattr(ax, "_orig_linewidths_extra"):
    ax._orig_linewidths_extra = []

ax._resp_lines_extra.extend([ph0_line, E16_line])
ax._orig_linewidths_extra.extend([ph0_line.get_linewidth(), E16_line.get_linewidth()])

# Store the point (single Line2D) and its original marker size
ax._resp_point_extra = pt_line
ax._orig_markersize_point = pt_line.get_markersize()

#remove default lines
remove_default_guides(ax, ph_target=7.0, v_target=0.0)

# ------------------------------------------------------
# STEP 1 — Sample (pH, V) space and label regions
# ------------------------------------------------------
pH_vals = np.linspace(-2, 16, 200)
V_vals  = np.linspace(-4, 4, 200)

sample_points = []
sample_labels = []

for pH in pH_vals:
    for V in V_vals:
        entry = pbx.get_stable_entry(pH, V)
        if entry is not None:
            sample_points.append([pH, V])
            sample_labels.append(entry.name)

sample_points = np.array(sample_points)

# ------------------------------------------------------
# STEP 2 — Group points by phase
# ------------------------------------------------------
unique_phases = sorted(set(sample_labels))

phase_points = {ph: [] for ph in unique_phases}

for (pt, ph) in zip(sample_points, sample_labels):
    phase_points[ph].append(pt)


# ------------------------------------------------------
# STEP 3 — For each phase, take convex hull to form polygon
# ------------------------------------------------------
for ph, pts in phase_points.items():
    pts = np.array(pts)
    if len(pts) < 3:
        continue  # need ≥3 points to form hull

    hull = ConvexHull(pts)
    poly = pts[hull.vertices]  # polygon vertices

    # Color by solid vs aqueous/ion
    if "(s)" in ph:
        facecolor = (0.55, 0.65, 1.0, 0.35)   # blue
    else:
        facecolor = (1.0, 0.75, 0.90, 0.35)    # pink

    patch = Polygon(poly, closed=True,
                    facecolor=facecolor,
                    edgecolor="black",
                    linewidth=0.8,
                    zorder=0.3)
    ax.add_patch(patch)

# ------------------------------------------------------
# STEP 4 — Double the label sizes (keep black)
# ------------------------------------------------------
for txt in ax.texts:
    txt.set_fontsize(txt.get_fontsize() * 1.25)
    txt.set_color("black")

# ------------------------------------------------------
# STEP 5 — Fix legend using the default red dashed water lines
# ------------------------------------------------------
dashed = [ln for ln in ax.get_lines() if ln.get_linestyle() == "--"]
if len(dashed) >= 2:
    dashed[0].set_label("Hydrogen Stability Line")
    dashed[1].set_label("Oxygen Stability Line")

#ax.legend(frameon=False, fontsize=14, loc="upper center", ncol=2)
ax.legend(frameon=False, loc="upper center", ncol=2)


# Create legend
leg = ax.legend(
    frameon=False,
    fontsize=14,
    loc="upper left",
    bbox_to_anchor=(0.76, 1.10)
)

# Store baseline anchor so we can scale relative to it
ax._legend_baseline_anchor = (0.76, 1.10)


# ------------------------------------------------------
# Axes labels and ticks
# ------------------------------------------------------
ax.set_xlabel("pH", fontsize=18)
ax.set_ylabel("Applied Potential (V vs. SHE)", fontsize=18)
ax.tick_params(labelsize=14)

plt.tight_layout()


# ------------------------------------------
# Dynamic font + line scaling on window resize
# ------------------------------------------

base_width = fig.get_figwidth()  # initial width in inches

# Store original line widths once
if not hasattr(ax, "_orig_linewidths"):
    ax._orig_linewidths = [ln.get_linewidth() for ln in ax.get_lines()]

def on_resize(event):
    new_width = fig.get_figwidth()
    scale = new_width / base_width

    # ---- Text scaling ----
    ax.xaxis.label.set_fontsize(14 * scale)
    ax.yaxis.label.set_fontsize(14 * scale)

    for t in ax.get_xticklabels() + ax.get_yticklabels():
        t.set_fontsize(14 * scale)

    leg = ax.get_legend()

    if leg:
    	# Scale legend text
    	for txt in leg.get_texts():
    		txt.set_fontsize(12 * scale)

    	# Scale legend line thickness
    	legend_lines = leg.get_lines()

    	# Store original legend line widths once
    	if not hasattr(leg, "_orig_linewidths"):
    		leg._orig_linewidths = [ln.get_linewidth() for ln in legend_lines]

    	for ln, orig_w in zip(legend_lines, leg._orig_linewidths):
    		ln.set_linewidth(orig_w * scale)

    for txt in ax.texts:   # phase labels
    	txt.set_fontsize(14 * 1.25 * scale)

    # ---- Line scaling (NEW) ----
    for ln, orig_w in zip(ax.get_lines(), ax._orig_linewidths):
        ln.set_linewidth(orig_w * scale)

	# ---- NEW: scale the reference guide lines & intersection marker ----
    if hasattr(ax, "_resp_lines_extra") and hasattr(ax, "_orig_linewidths_extra"):
        for ln, w0 in zip(ax._resp_lines_extra, ax._orig_linewidths_extra):
            ln.set_linewidth(w0 * scale)

    if hasattr(ax, "_resp_point_extra") and hasattr(ax, "_orig_markersize_point"):
        ax._resp_point_extra.set_markersize(ax._orig_markersize_point * scale)

    fig.canvas.draw_idle()

fig.canvas.mpl_connect("resize_event", on_resize)

# ------------------------------------------------------


plt.savefig('Pourbaix_' + element + '.png')
I am also attaching a Google Drive link which is a comprehensive comparison between MP API and MP Pourbaix Diagram’s Webpage. This PDF covers all elements except for f-block elements and those without Pourbaix Diagrams on the Webpage.
Thank you, and I am looking forward to your response.