Hello!
I am using VASP to study metal hexacyanoferrates, in particular tertiary metal hexacyanoferrates (MnxNi1-x[Fe(CN)6]). There appears to be a discrepancy between the analysis of my FTIR data and the calculated charge density of the materials as I vary the ration Mn/Ni’. Experimentally, the two FTIR absorption peaks to note are the cyanide stretching frequency, v(CN), and the iron carbon stretching frequency, v(Fe-C). As M increases, and thus M’ decreases, v(CN) shifts to lower wave numbers and v(Fe-C) shifts to higher wavenumbers, i.e.
- Mn UP and Ni DOWN => v(CN) DOWN
- Mn UP and Ni DOWN => v(Fe-C) UP
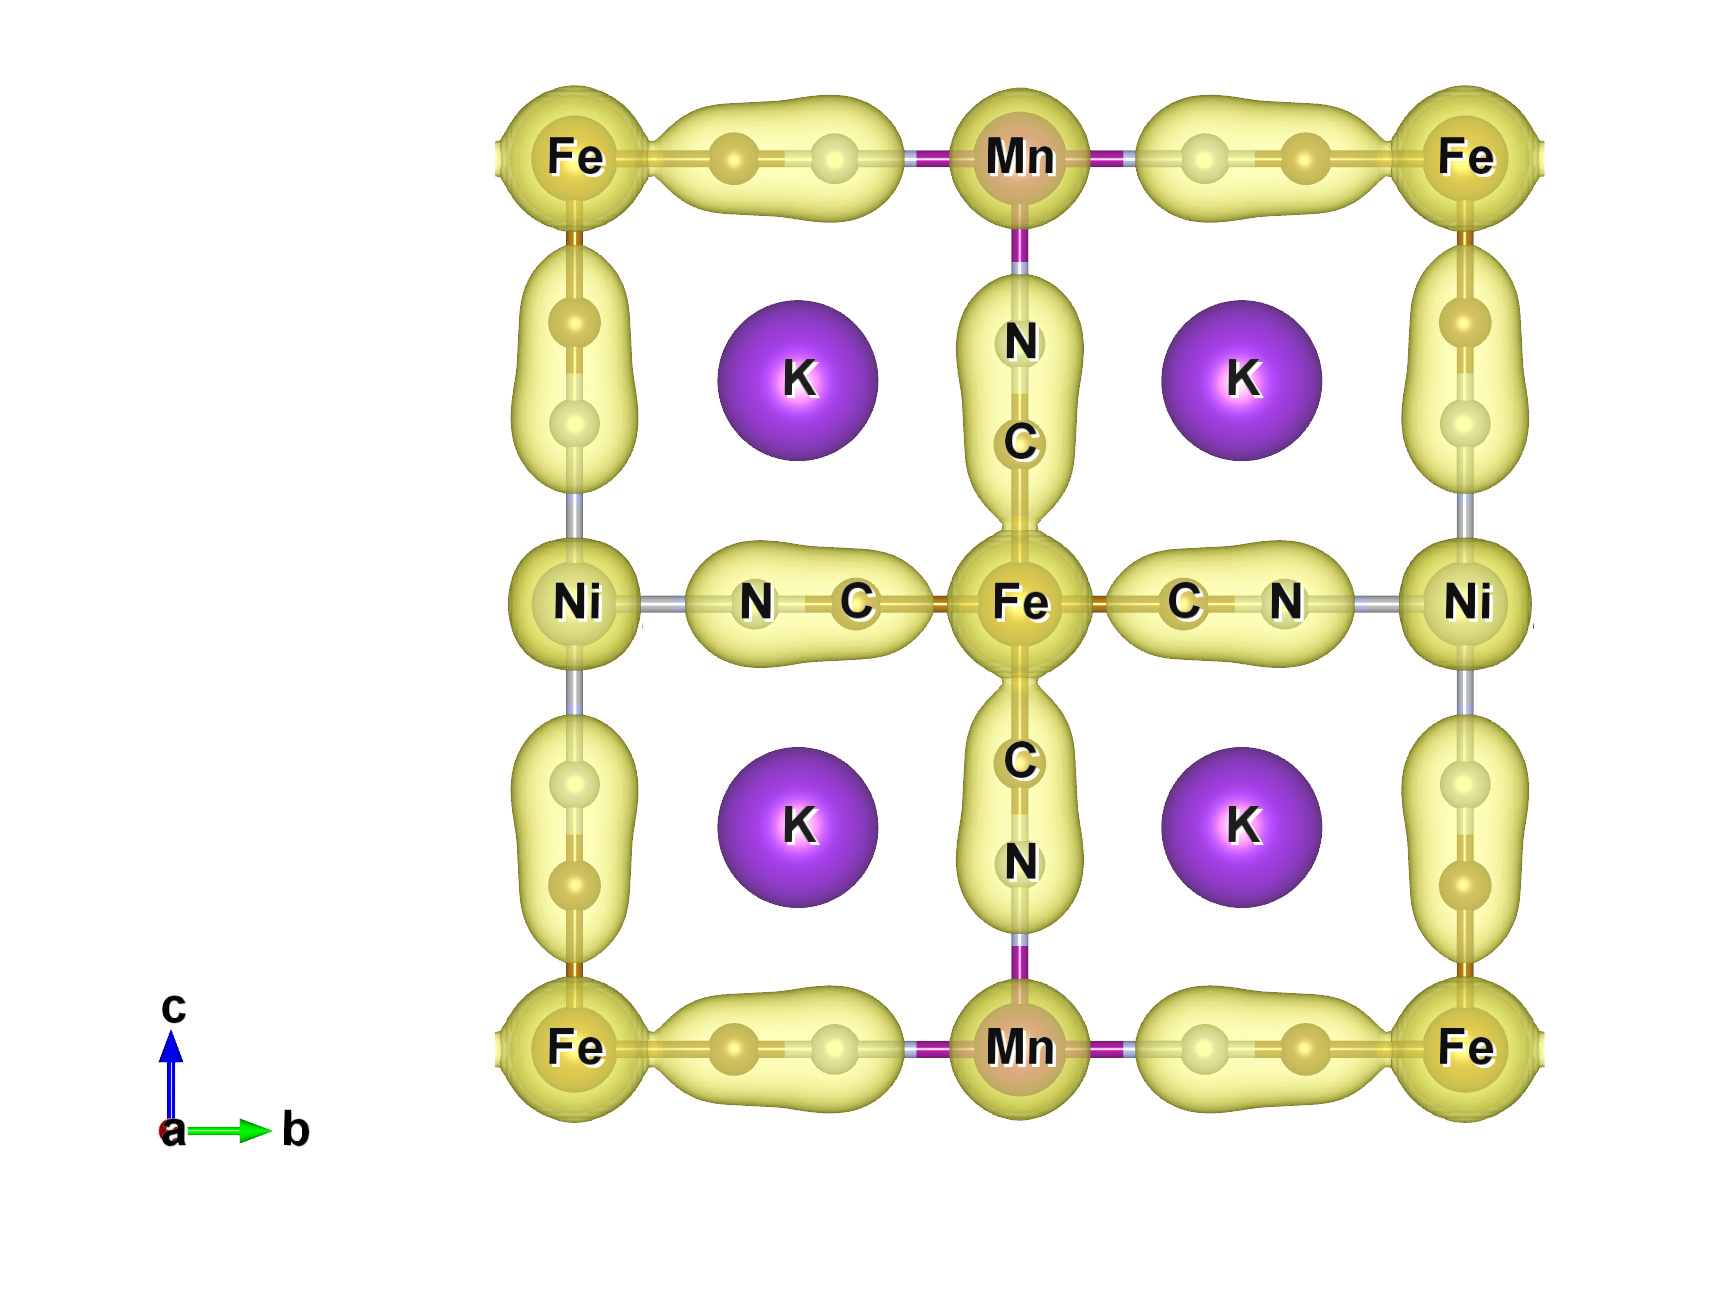
This is interpreted as a weakening of the CN bond and a strengthening of the Fe-C bond, which is in turn interpreted as a shift in the charge density across the cyanide towards the iron atom. However, when I calculate the charge density in VASP the charge on the Fe and C does not increase with respect to increasing M. I followed up the VASP calculation by performing bader charge analysis and got similar results. Conversely, when I visualize the charge density using VESTA with a fixed isosurface value for ever material, it appears that the charge density along the Mn-N-C-Fe chain is shifted towards the Fe end compared to the Ni-N-C-Fe chain (see figure
)
I know that metal hexacyanoferrates are relatively complicated to study because spin polarization has to be taken into account as well as on-site hubbard potentials. I may have some error in my initial calculation or how I am calculation the charge density on the atoms. Or possibly I am focusing too much on the charge density plots. II have attached my INCAR and KPOINT files
If anyone has any ideas or suggestions on paths to take that would be greatly appreciated. I have exhausted what I thought could work.
Best,