Hello,
I am computing the radial distribution function for a small 2D hexagonal system of atoms generated in LAMMPS. For verification, I am computing the RDF from the LAMMPS data file using both OVITO and ASE (atomic simulation environment). Through visualization in OVITO, I know that the first three neighbors are at the following distances from a central atom:
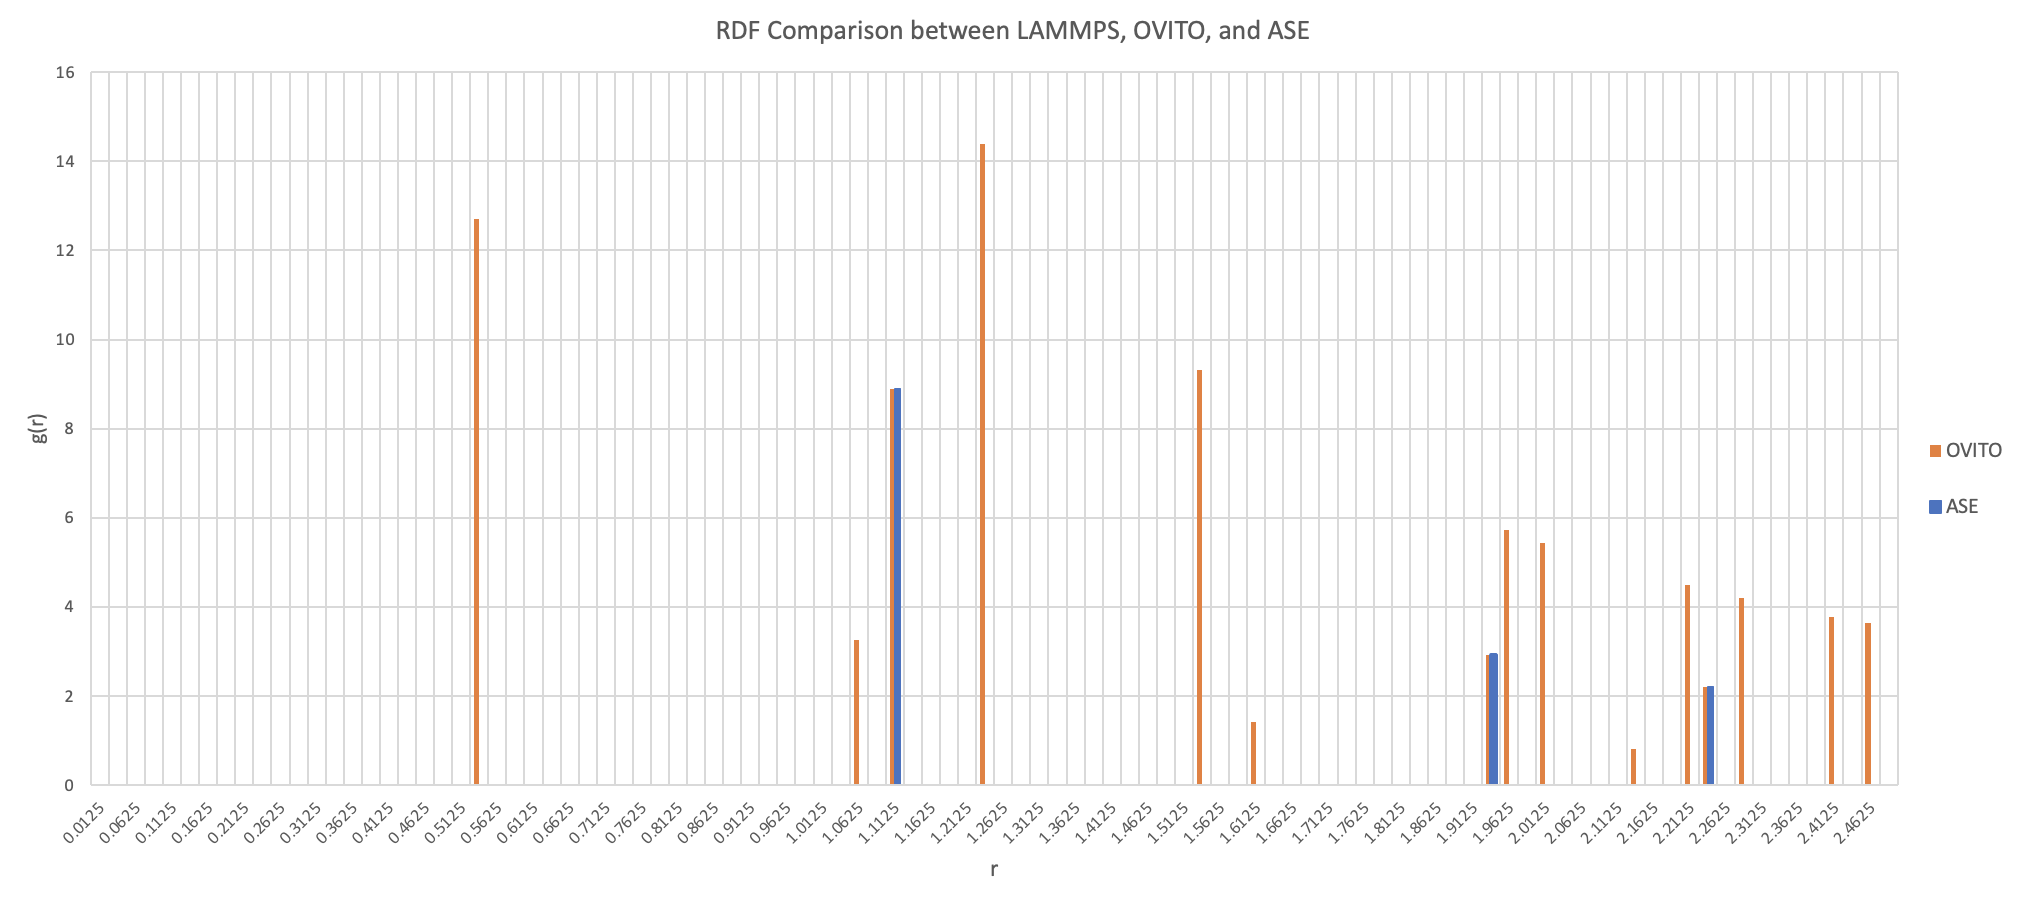
- r (nearest neighbor) = 1.1132
- r (2nd neighbor) = 1.92811
- r (3rd neighbor) = 2.2264
As seen in the plot below, ASE is correctly finding g(r) peaks at these three values only (blue). OVITO, however, is finding peaks at many additional r values (orange). These distances do not correlate to neighbor distances, so my question is: why do these extra g(r) peaks show up in OVITO’s RDF? What distances is it computing? These computations are done for the same cutoff value and same number of bins.
I have attached the LAMMPS data file, the python script to compute the RDF with ASE, and the excel file containing the RDF data and above plot of the RDF comparison.
Thank you,
Chloe
data.A00_sample_ground_mc_final_8x5 (4.9 KB)
ASE_RDF_v6.py (757 Bytes)
RDF_A00_Sample_Comparisons.xlsx (18.9 KB)
