So I bit the bullet and just edited the class, like this. Put this in dos_plotter_axes.py:
from collections import OrderedDict
from monty.json import jsanitize
from pymatgen.electronic_structure.core import OrbitalType, Spin
import numpy as np

class DosPlotterAxes:
    """
    Modified Pymatgen class for plotting DOSs. Note that the interface is
    extremely flexible given that there are many different ways in which people
    want to view DOS. The typical usage is:

        # Initializes plotter with some optional args. Defaults are usually
        # fine,
        plotter = DosPlotterAxes()

        # Adds a DOS with a label.
        plotter.add_dos("Total DOS", dos)

        # Alternatively, you can add a dict of DOSs. This is the typical
        # form returned by CompleteDos.get_spd/element/others_dos().
        plotter.add_dos_dict({"dos1": dos1, "dos2": dos2})
        plotter.add_dos_dict(complete_dos.get_spd_dos())
    """

    def __init__(self, zero_at_efermi=True, stack=False, sigma=None):
        """
        Args:
            zero_at_efermi: Whether to shift all Dos to have zero energy at the
                fermi energy. Defaults to True.
            stack: Whether to plot the DOS as a stacked area graph
            key_sort_func: function used to sort the dos_dict keys.
            sigma: A float specifying a standard deviation for Gaussian smearing
                the DOS for nicer looking plots. Defaults to None for no
                smearing.
        """
        self.zero_at_efermi = zero_at_efermi
        self.stack = stack
        self.sigma = sigma
        self._doses = OrderedDict()

    def add_dos(self, label, dos):
        """
        Adds a dos for plotting.

        Args:
            label:
                label for the DOS. Must be unique.
            dos:
                Dos object
        """
        energies = dos.energies - dos.efermi if self.zero_at_efermi else dos.energies
        densities = dos.get_smeared_densities(self.sigma) if self.sigma else dos.densities
        efermi = dos.efermi
        self._doses[label] = {
            "energies": energies,
            "densities": densities,
            "efermi": efermi,
        }

    def add_dos_dict(self, dos_dict, key_sort_func=None):
        """
        Add a dictionary of doses, with an optional sorting function for the
        keys.

        Args:
            dos_dict: dict of {label: Dos}
            key_sort_func: function used to sort the dos_dict keys.
        """
        if key_sort_func:
            keys = sorted(dos_dict.keys(), key=key_sort_func)
        else:
            keys = dos_dict.keys()
        for label in keys:
            self.add_dos(label, dos_dict[label])

    def get_dos_dict(self):
        """
        Returns the added doses as a json-serializable dict. Note that if you
        have specified smearing for the DOS plot, the densities returned will
        be the smeared densities, not the original densities.

        Returns:
            dict: Dict of dos data. Generally of the form
            {label: {'energies':..., 'densities': {'up':...}, 'efermi':efermi}}
        """
        return jsanitize(self._doses)

    def get_plot(self, ax, xlim=None, ylim=None):
        """
        Get a matplotlib plot showing the DOS.

        Args:
            ax : the matplotlib axes onto which to plot.
            xlim: Specifies the x-axis limits. Set to None for automatic
                determination.
            ylim: Specifies the y-axis limits.
        """

        ncolors = max(3, len(self._doses))
        ncolors = min(9, ncolors)

        import palettable

        # pylint: disable=E1101
        colors = palettable.colorbrewer.qualitative.Set1_9.mpl_colors

        y = None
        alldensities = []
        allenergies = []

        # Note that this complicated processing of energies is to allow for
        # stacked plots in matplotlib.
        for key, dos in self._doses.items():
            energies = dos["energies"]
            densities = dos["densities"]
            if not y:
                y = {
                    Spin.up: np.zeros(energies.shape),
                    Spin.down: np.zeros(energies.shape),
                }
            newdens = {}
            for spin in [Spin.up, Spin.down]:
                if spin in densities:
                    if self.stack:
                        y[spin] += densities[spin]
                        newdens[spin] = y[spin].copy()
                    else:
                        newdens[spin] = densities[spin]
            allenergies.append(energies)
            alldensities.append(newdens)

        keys = list(self._doses.keys())
        keys.reverse()
        alldensities.reverse()
        allenergies.reverse()
        allpts = []
        for i, key in enumerate(keys):
            x = []
            y = []
            for spin in [Spin.up, Spin.down]:
                if spin in alldensities[i]:
                    densities = list(int(spin) * alldensities[i][spin])
                    energies = list(allenergies[i])
                    if spin == Spin.down:
                        energies.reverse()
                        densities.reverse()
                    x.extend(energies)
                    y.extend(densities)
            allpts.extend(list(zip(x, y)))
            if self.stack:
                ax.fill(x, y, color=colors[i % ncolors], label=str(key))
            else:
                ax.plot(x, y, color=colors[i % ncolors], label=str(key), linewidth=3)
            if not self.zero_at_efermi:
                ylim = ax.set_ylim()
                ax.plot(
                    [self._doses[key]["efermi"], self._doses[key]["efermi"]],
                    ylim,
                    color=colors[i % ncolors],
                    linestyle="--",
                    linewidth=2,
                )

        if xlim:
            ax.set_xlim(xlim)
        if ylim:
            ax.set_ylim(ylim)
        else:
            xlim = ax.set_xlim()
            relevanty = [p[1] for p in allpts if xlim[0] < p[0] < xlim[1]]
            ax.set_ylim((min(relevanty), max(relevanty)))

        if self.zero_at_efermi:
            ylim = ax.set_ylim()
            ax.plot([0, 0], ylim, "k--", linewidth=2)

        ax.set_xlabel("Energies (eV)")
        ax.set_ylabel("Density of states")

        ax.axhline(y=0, color="k", linestyle="--", linewidth=2)
        ax.legend()
Then, with this file importable from your working directory or elsewhere on your PYTHONPATH, you can make a plot like this:
from dos_plotter_axes import DosPlotterAxes

# Make our DOS plotter
plotter = DosPlotterAxes(zero_at_efermi=False, stack=False)
plotter.add_dos(label="test", dos=o_dos)

# Make the plot
fig, ax = plt.subplots(2, 1, sharex=True, figsize=(8, 6))
fig.subplots_adjust(hspace=0, left=0.18)

# Plot on each separate axis
plotter.get_plot(ax=ax[0])
plotter.get_plot(ax=ax[1])

# Clean things up
ax[0].set_xlabel(None)
ax[0].set_ylabel(None)
fig.text(x=0.1, y=0.5, s=ax[1].get_ylabel(), va="center", ha="center", rotation=90)
ax[1].set_ylabel(None)
Looks like this:
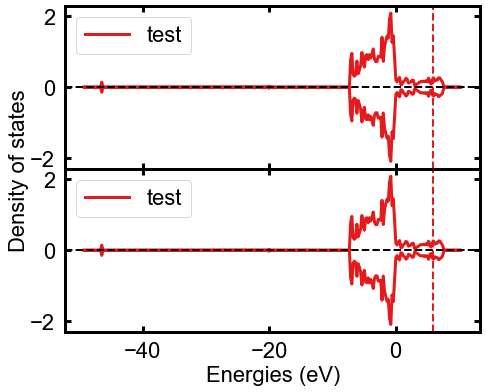
That way, you still get the features of the DosPlotter class, like stacked DOS plots, but now you can have them as subplots, too.