Okay, getting a little further. Here’s a function I adapted from the gist:
def move_axes(ax, new_ax, fig, nrows, ncols, index):
    """
    Move an Axes object from a figure to a new pyplot managed Figure in
    the specified subplot.

    Adapted from https://gist.github.com/salotz/8b4542d7fe9ea3e2eacc1a2eef2532c5.
    """

    # get a reference to the old figure context so we can release it
    old_fig = ax.figure

    # remove the Axes from it's original Figure context
    try:
        ax.remove()
    except ValueError:
        pass

    # set the pointer from the Axes to the new figure
    ax.figure = fig

    # Get reference to original axes in the new figure
    new_axes = new_ax


    # add the Axes to the registry of axes for the figure
    fig.axes.append(ax)
    # twice, I don't know why...
    fig.add_axes(ax)

    # then to actually show the Axes in the new figure we have to make
    # a subplot with the positions etc for the Axes to go, so make a
    # subplot which will have a dummy Axes
    dummy_ax = fig.add_subplot(nrows, ncols, index)

    # Add some label text to alter position
    dummy_ax.set_xlabel("test")
    dummy_ax.set_ylabel("test")
    dummy_ax.set_title("test")

    # then copy the relevant data from the dummy to the ax
    ax.set_position(dummy_ax.get_position())
    # ax.set_position(new_axes.get_position())

    # then remove the dummy and original axes
    dummy_ax.remove()
    new_axes.remove()

    # close the figure the original axis was bound to
    plt.close(old_fig)
and the attempt to plot a grid of these plots
# Okay, try making a grid of DOS plots
# Not working...
fig, axs = plt.subplots(5, 5, figsize=(20, 20))
k = 1
for (label, test_cdos), ax in zip(shifted_dos_data.items(), axs.flatten()):
    o_dos = test_cdos.get_element_spd_dos(el="O")[OrbitalType.p]
    plotter = dos_plotter.DosPlotter()
    plotter.add_dos(label=label, dos=o_dos)
    the_plot = plotter.get_plot()
    test_fig, test_ax = the_plot.gcf(), the_plot.gca()

    test_fig.set_size_inches(8, 6)
    test_ax.set_title(label)

    move_axes(test_ax, ax, fig, nrows=5, ncols=5, index=k)
    k += 1

fig.set_size_inches(20, 20)
fig.savefig("grid-test.pdf", bbox_inches="tight", pad_inches=0.1)
It clearly plots them in a grid, but I can’t seem to place them correctly to fill the plot. Result in jupyter notebook:

And printed to PDF:
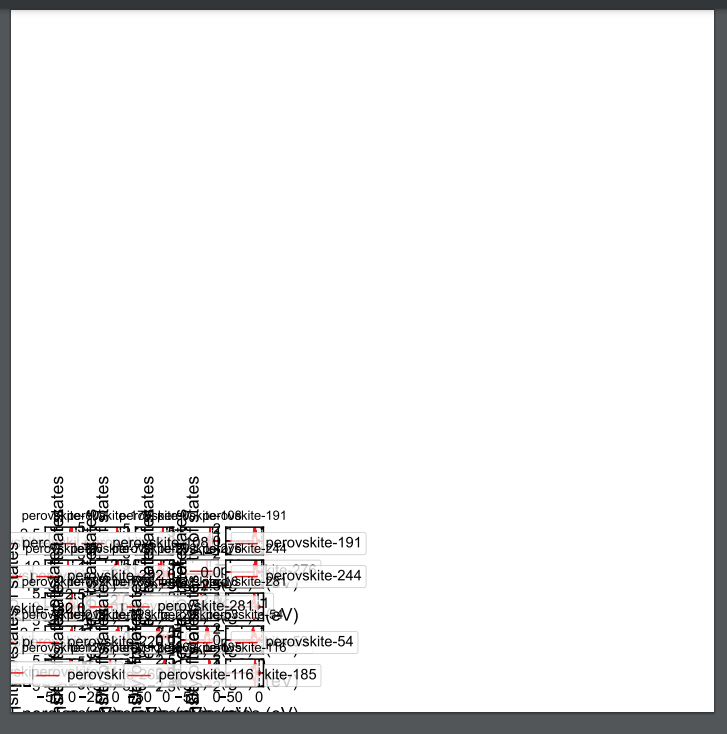
So somehow inserting the new axes stops you from being able to resize the plot? Or there’s some global canvas within the plot that you have to enlarge to get the grid of subplots to spread out?