Hello,
analogous to drawing a plane via the Slice option in the GUI, it would be nice to be able to draw a custom vector, originating at a specified point.
As far as i am aware, such feature does not exist in the GUI. My apologies if that is incorrect.
My typical workaround is to add fake atoms into the xyz structure file, with the elements of the vector i want to draw as “force” columns of these fake atoms. In practice this can be a bit consuming since it means editing the input file each time i want to add/remove some vector from the picture.
Is there any better (faster) workaround for doing this?
Hi,
Yes, you are right that drawing custom vectors is not directly possible at the moment. In your specific case, how many vectors are you trying to visualize? Are their positions, directions, and lengths static, or need to be dynamically adjusted?
Let me outline the currently available functions in OVITO:
OVITO Basic:
- Your workaround could be “slightly improved” by importing additional “ghost” atoms with vector properties from a separate file using the Combine Datasets modifier. This way you can avoid editing the original file source.
Combine datasets — OVITO User Manual 3.10.6 documentation
OVITO Pro:
-
You can work with a second pipeline containing ghost atoms and attached vector information only, which can be superimposed on the particles in the other pipeline.
If you do not want to import data from a separate file, you can create the ghost atoms and vectors directly in the desktop application by defining a Python script data source. For more information, see
Data sources — OVITO User Manual 3.10.6 documentation
Python script pro — OVITO User Manual 3.10.6 documentation
-
A user-defined viewport layer can be used to draw two-dimensional content on top of the three-dimensional scene. For example, see code example O3 in the OVITO python reference: Highlight a particle.
-
The recently added ovito.data.Lines and ovito.vis.LinesVis classes (available in OVITO Pro 3.10.0 and later) allow visualizing line segments in 3D space - without needing to associate them with any particles. However, drawing vector heads is not yet supported. Is this a feature you would be interested in?
ovito.data — OVITO Python Reference 3.10.6 documentation
Hello,
thanks alot for the answer!
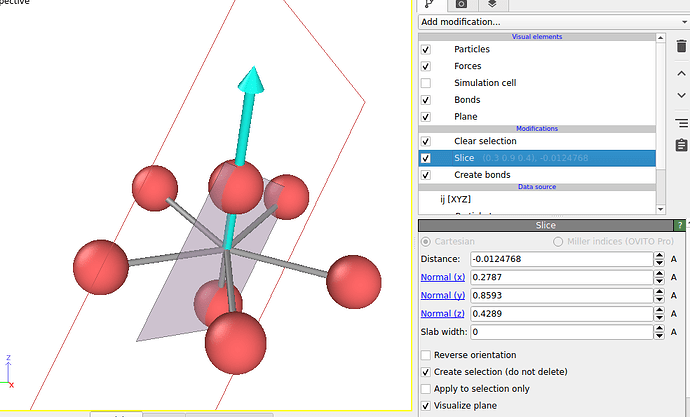
My current use case is with static vectors, specifically i am visualizing the axes and planes of symmetry operations on a non-periodic structure, coming from a separate code. I write the atomic positions into an xyz file, together with the axes of rotations as “ghost” atoms with forces being the axes, while the mirror planes i input manually with the Slice modifier.
My typical xyz file then looks like this, with one axis added:
 8
 properties=type:I:1:pos:R:3:force:R:3:radius:R:1
  1  -0.0403776439  -0.9452287895  -0.2497444792    0.0 0.0 0.0   0.2
  1   0.7084982831  -0.4709982916   0.483378694     0.0 0.0 0.0   0.2
  1  -0.3598553380  -0.0986031588   0.431370100     0.0 0.0 0.0   0.2
  1   0.3598547555   0.0986022296  -0.431368491     0.0 0.0 0.0   0.2
  1   0.4782526199   0.6541364440   0.548488805     0.0 0.0 0.0   0.2
  1  -0.7334519705  -0.1131849802  -0.637730214     0.0 0.0 0.0   0.2
  1  -0.4129207060   0.8752765465  -0.1443944144    0.0 0.0 0.0   0.2
 0    0.0            0.0            0.0             -0.6309  -0.1729   0.7563  0.01
And adding a mirror plane as Slice:
The number of vectors i would draw in the same picture is typically “small”, as in less than 10 for sure.
Potentially, it could be nice to be able to group vectors by some id, such that each group could be colored independently (in the case above for example to distinguish C2 and C5 axes). Currently this could be achieved with adding another 3 columns into the input, and reading fake “velocity” or some other vector property.
The specific use case is maybe not very common, but i think having a quick way to plot some vectors directly from the GUI could be useful in general.
