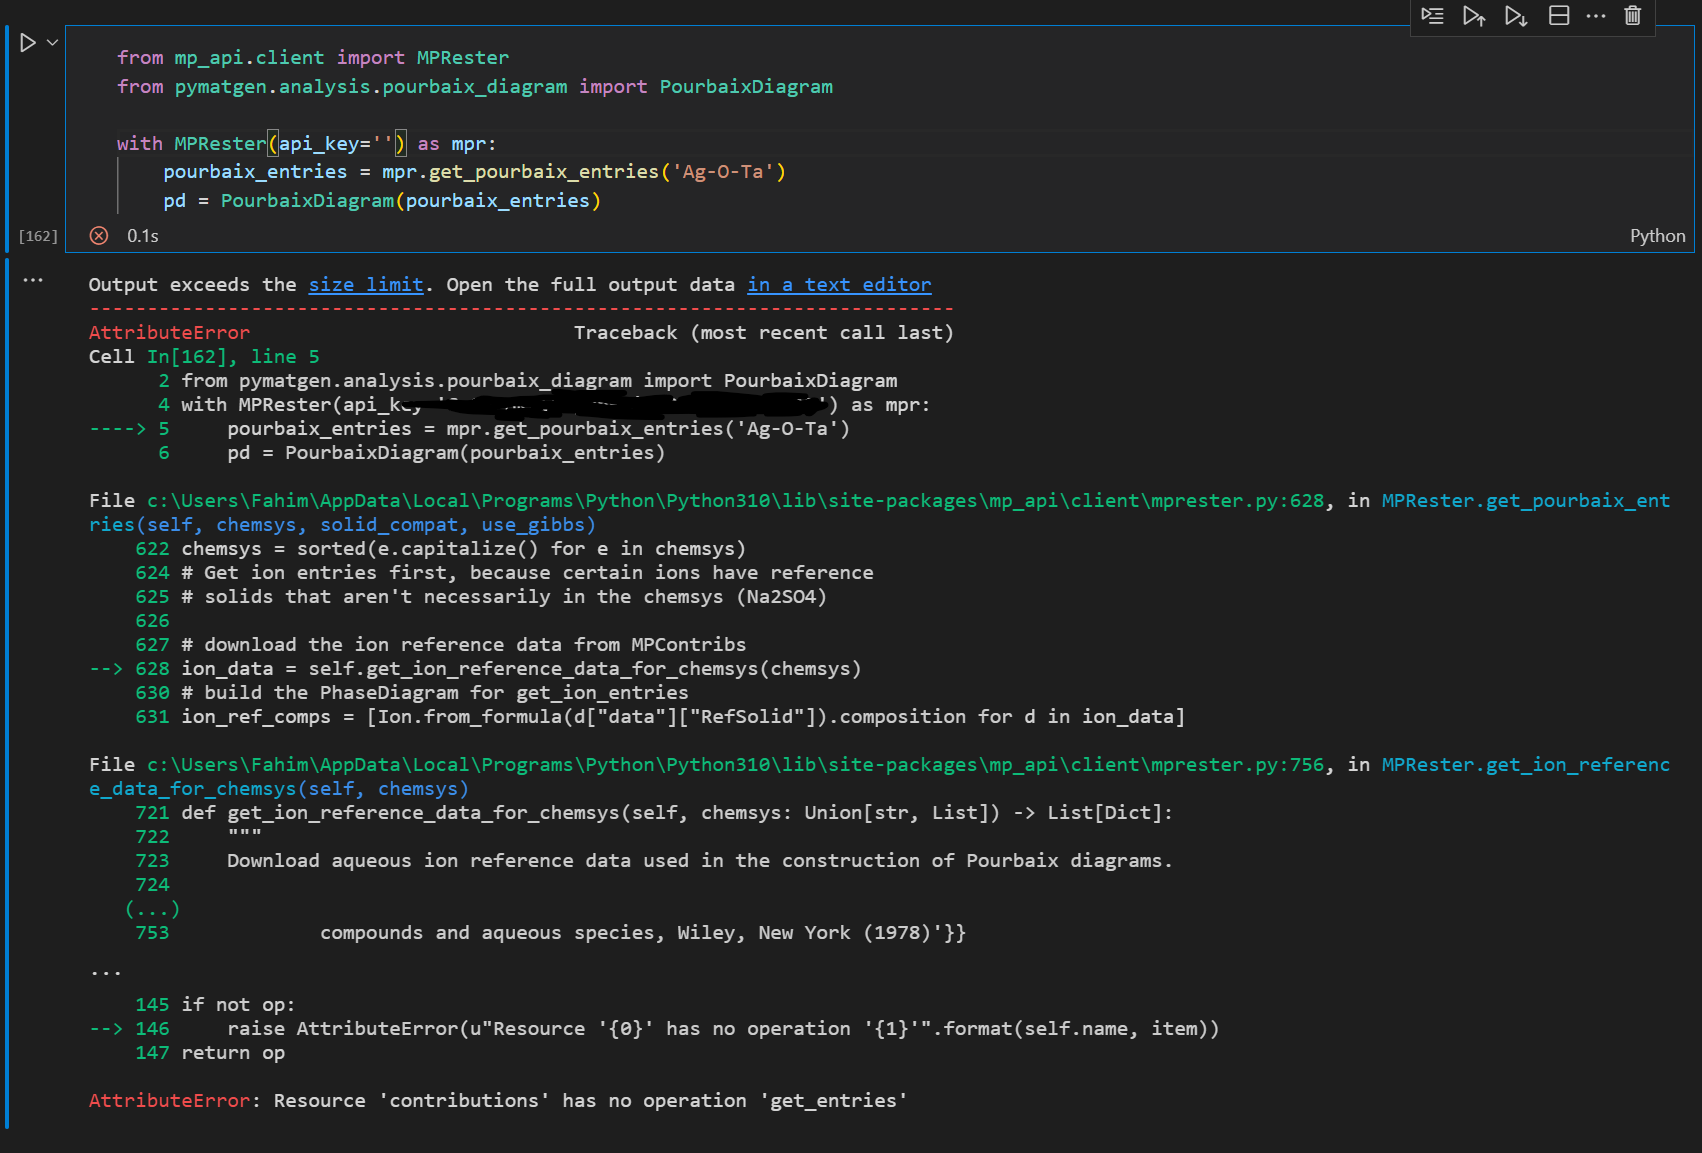
I have been receiving some difficulty in producing a pourbaix diagram following the code from the website. However i am continuously getting this error as shown from the picture.
Try updating your mp-api client.
I have already tried pip install mp-api. Unfortunately it is still not working.
Did you run pip install -U mp-api? The latest version of the client does not use get_entries anymore (see here). You might also have to update mpcontribs-client. HTH.
Dear Sir,@tschaume
I tried the code for make Pourbaix Diagram of (ZnMn2O4 (mp-18751-GGA+U))
However, I have the erorr " Composition of stability entry does not match Pourbaix Diagram"
This is my used code:
# Import necessary tools from pymatgen
from pymatgen.analysis.pourbaix_diagram import PourbaixDiagram, PourbaixPlotter
from mp_api.client import MPRester

%matplotlib inline

# Initialize the MP Rester
mpr = MPRester("API")
# Get all pourbaix entries corresponding to the Zn-Mn-O-H chemical system.
entries = mpr.get_pourbaix_entries(["Zn", "Mn"])
# Construct the PourbaixDiagram object
pbx1 = PourbaixDiagram(
    entries,
    comp_dict={"Zn": 0.5, "Mn": 0.5},
    conc_dict={"Zn": 1e-6, "Mn": 1e-6},
    filter_solids=True,
)
plotter = PourbaixPlotter(pbx1)
plotter.get_pourbaix_plot().show()

entry = [entry for entry in entries if entry.entry_id == "mp-18751-GGA+U"][0]
plt = plotter.plot_entry_stability(entry)

)
ValueError Traceback (most recent call last)
Cell In[156], line 2
1 entry = [entry for entry in entries if entry.entry_id == “mp-18751-GGA+U”][0]
----> 2 plt = plotter.plot_entry_stability(entry)
File ~\miniconda3\Lib\site-packages\pymatgen\analysis\pourbaix_diagram.py:1059, in PourbaixPlotter.plot_entry_stability(self, entry, pH_range, pH_resolution, V_range, V_resolution, e_hull_max, cmap, ax, **kwargs)
1053 ax = self.get_pourbaix_plot(ax=ax, **kwargs)
1054 pH, V = np.mgrid[
1055 pH_range[0] : pH_range[1] : pH_resolution * 1j,
1056 V_range[0] : V_range[1] : V_resolution * 1j,
1057 ]
→ 1059 stability = self._pbx.get_decomposition_energy(entry, pH, V)
1061 # Plot stability map
1062 cax = ax.pcolor(pH, V, stability, cmap=cmap, vmin=0, vmax=e_hull_max)
File ~\miniconda3\Lib\site-packages\pymatgen\analysis\pourbaix_diagram.py:837, in PourbaixDiagram.get_decomposition_energy(self, entry, pH, V)
833 entry_pbx_comp = Composition(
834 {elt: coeff for elt, coeff in entry.composition.items() if elt not in ELEMENTS_HO}
835 ).fractional_composition
836 if entry_pbx_comp != pbx_comp:
→ 837 raise ValueError(“Composition of stability entry does not match Pourbaix Diagram”)
838 entry_normalized_energy = entry.normalized_energy_at_conditions(pH, V)
839 hull_energy = self.get_hull_energy(pH, V)
ValueError: Composition of stability entry does not match Pourbaix Diagram
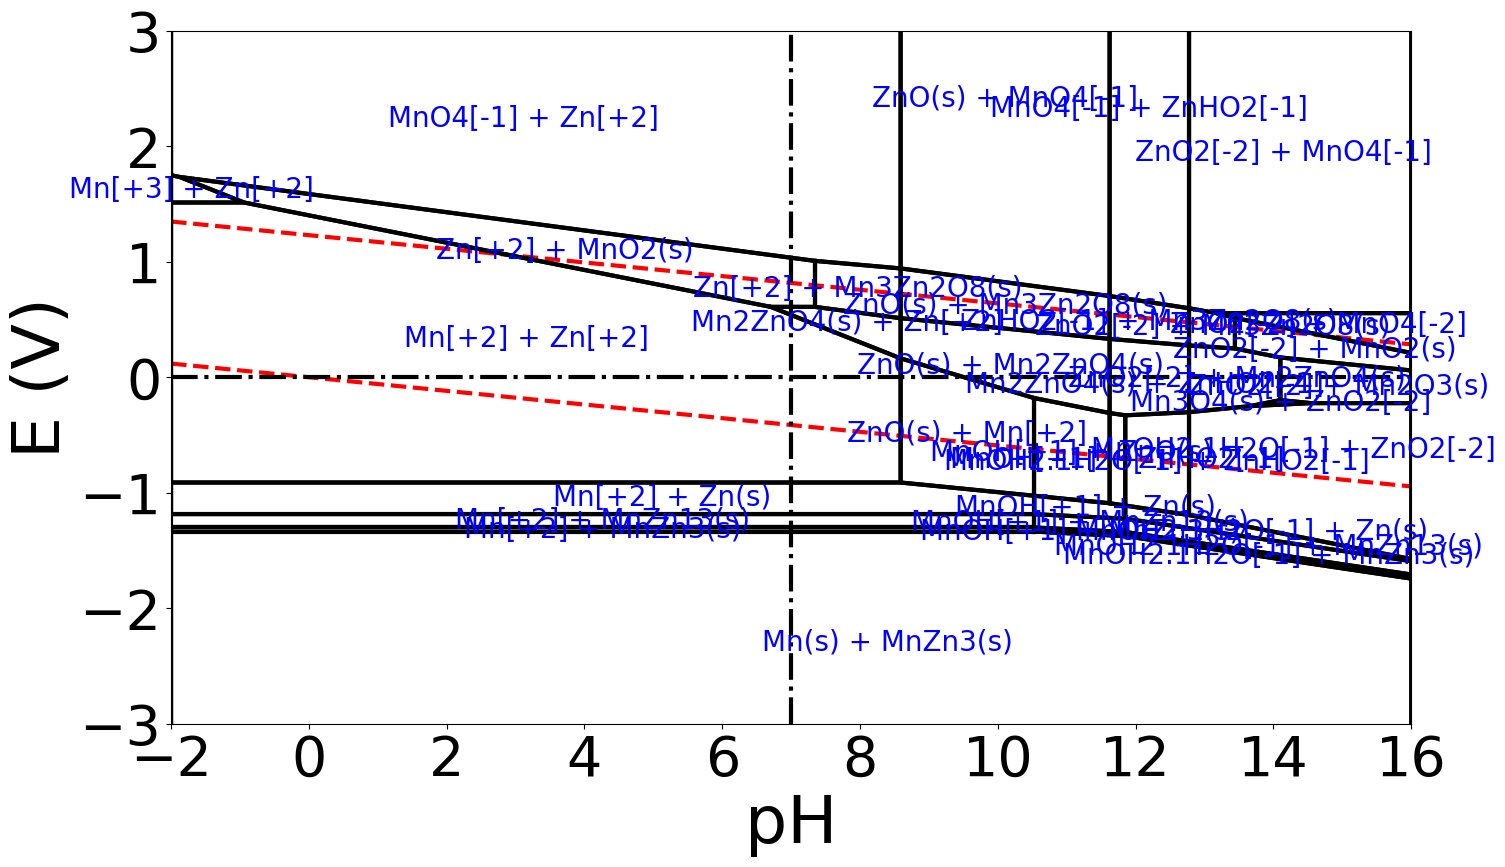
I have the Poubaix Diagram without ΔGpbx as bellow ,
How can I fix this erorr and the plot can show ΔGpbx,
I am really hope you can help in this case,
Thank you so much!
I believe this is the source of your error. You are seeking the stability of ZnMn2O4 (which has a Zn:Mn ratio of 1:2), but you have constructed the diagram with a 1:1 Zn:Mn ratio.
Does the error go away if you set
comp_dict={"Zn": 0.33, "Mn": 0.67},
?
Dear sir,
I used the new ratio as your instruction,
I sloved the problem,
Thank you so much for helping,
Thread closed due to inactivity, please open a new thread to address related issues.