Error with get_element_profile

Hi, I would like to estimate the grand lithium potential for LiPS5Cl. Here is the code:

from pymatgen import MPRester, Composition, Element
from pymatgen.io.vasp import Vasprun
from pymatgen.analysis.phase_diagram import PhaseDiagram, CompoundPhaseDiagram, PDPlotter
from pymatgen.entries.computed_entries import ComputedEntry
from pymatgen.entries.compatibility import MaterialsProjectCompatibility
import json, re, palettable
import matplotlib as mpl
vasprun = Vasprun("vasprun.xml.relax2.gz")
entry = vasprun.get_computed_entry(inc_structure=True)

rester = MPRester(api_key='XXXXXXXXXXXXXXX')
mp_entries = rester.get_entries_in_chemsys(["Li", "P", "S", "Cl"])

#print(mp_entries)

with open("lpo_entries.json") as f:
    lpo_data = json.load(f)
lpo_entries = [ComputedEntry.from_dict(d) for d in lpo_data]

compatibility = MaterialsProjectCompatibility()
entry = compatibility.process_entry(entry)
entries = compatibility.process_entries([entry] + mp_entries + lpo_entries)
Li_entries = [e for e in entries  if e.composition.reduced_formula == "Li"]
uli0 = min(Li_entries, key=lambda e:e.energy_per_atom).energy_per_atom

el_profile = PhaseDiagram.get_element_profile(element=Element("Li"), comp=entry.composition)
for i, d in enumerate(el_profile):
    voltage = -d(["chempot"] - uli0)
    print("Voltage: %s V" % voltage)
    print(d["reaction"])
    print("")

I got the following error:

el_profile = PhaseDiagram.get_element_profile(element=Element("Li"), comp=entry.composition)

TypeError: get_element_profile() missing 1 required positional argument: 'self'

May you please tell me how to correct this code?
Hi @thienbinh92,

this is a classic error that I stumbled over many time, that has really nothing to do with pymatgen, but with python classes and their objects.
get_element_profile is not a static method of PhaseDiagram, so you can not call it without initializing a PhaseDiagram object first.

Here is a more minimal example (not requiring to load any data from files) of your code that works, but is probably useless, since I have not worked with pymatgen phase diagrams before and have no idea what I am actually doing:

from pymatgen.ext.matproj import MPRester
from pymatgen.core import Composition, Element
from pymatgen.analysis.phase_diagram import PhaseDiagram, PDEntry

rester = MPRester()
mp_entries = rester.get_entries_in_chemsys(["Li", "P", "S", "Cl"])
pd_entries = []
# here we create a list of PDEntries that are necessary to initialize
# the PhaseDiagram object
for entry in mp_entries:
    pd_entries.append(PDEntry(composition=entry.composition,
                              energy=entry.energy))
 
# here we initialize the object wich needs a list of PDEntries  
PD = PhaseDiagram(pd_entries)

comp = Composition("Li12 P4 S16")
#now we can call the get_element_profile method
el_profile = PD.get_element_profile(element=Element("Li"), comp=comp)
for i, d in enumerate(el_profile):
    print(d["reaction"])
    print("")

P.S.: This assumes your MAPI key is set in ~/.pmgrc.yaml

2 Likes

Dear @mwo,
I have a question about calculation Voltage of material ZnCr2O4 by Pymatgen. After VASP calculation, I used the code as bellow:

from pymatgen.core import Composition, Element
from pymatgen.entries.compatibility import MaterialsProjectCompatibility
from pymatgen.entries.computed_entries import ComputedEntry
from mp_api.client import MPRester
from pymatgen.io.vasp import Vasprun
from pymatgen.util.plotting import pretty_plot
%matplotlib inline
import re
import matplotlib as mpl
import palettable
from pymatgen.analysis.phase_diagram import (CompoundPhaseDiagram,PDPlotter,PhaseDiagram,)
from pymatgen.analysis.interface_reactions import GrandPotentialInterfacialReactivity, InterfacialReactivity
from pymatgen.core import Composition, Element

API=‘API KEy'
rester = MPRester(API)
vasprun = Vasprun("vasprun.xml")
entry = vasprun.get_computed_entry(inc_structure=True)
rester = MPRester(API)
mp_entries = rester.get_entries_in_chemsys(["Zn", "Cr", "O"])
compatibility = MaterialsProjectCompatibility()
entry = compatibility.process_entry(entry)
entries = compatibility.process_entries([entry] + mp_entries)
pd = PhaseDiagram(entries)
comp = Composition("ZnCr2O4")
#now we can call the get_element_profile method
el_profile = pd.get_element_profile(element=Element("Zn"), comp=comp)

uZn0 = -1.259
for i, d in enumerate(el_profile):
    voltage = -(d["chempot"] - uZn0)
    print("Voltage: %s V" % voltage)
    print(d["reaction"])
    print("")

After run this code, I have reaction:

Voltage: 0.0007436100000000057 V
ZnCr2O4 → ZnCr2O4

Voltage: 3.6552094650000035 V
ZnCr2O4 → 2 CrO2 + Zn

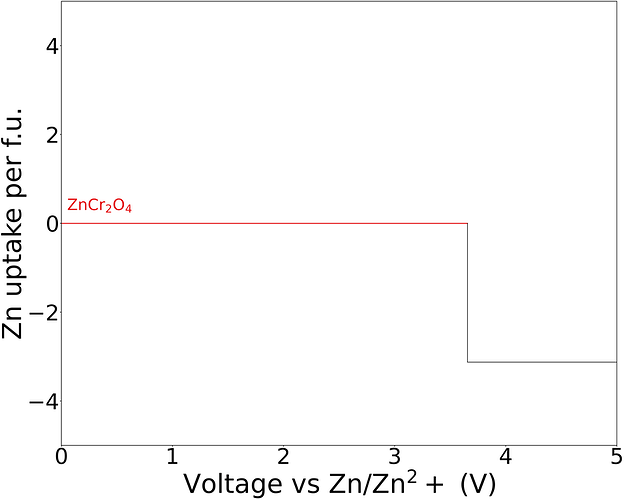
I draw the plot of ‘‘voltage& Zn uptake per f.u’’ by the code:

mpl.rcParams['axes.linewidth']=3
mpl.rcParams['lines.markeredgewidth']=4
mpl.rcParams['lines.linewidth']=3
mpl.rcParams['lines.markersize']=15
mpl.rcParams['xtick.major.width']=3
mpl.rcParams['xtick.major.size']=8
mpl.rcParams['xtick.minor.width']=3
mpl.rcParams['xtick.minor.size']=4
mpl.rcParams['ytick.major.width']=3
mpl.rcParams['ytick.major.size']=8
mpl.rcParams['ytick.minor.width']=3
mpl.rcParams['ytick.minor.size']=4
# Plot of Li uptake per formula unit (f.u.) of Li6PS5Cl against voltage vs Li/Li+.
colors = palettable.colorbrewer.qualitative.Set1_9.mpl_colors
plt = pretty_plot(50, 40)
for i, d in enumerate(el_profile):
    v = - (d["chempot"] - uZn0)
    if i != 0:
        plt.plot([x2, x2], [y1, 100*d["evolution"]/32 ], 'k', linewidth=3)
    x1 = v
    y1 =100* d["evolution"] /32
    if i != len(el_profile) - 1:
        x2 = - (el_profile[i + 1]["chempot"] - uZn0)
    else:
        x2 = 5.0
    if i in [0, 4, 5, 7]:
        products = [re.sub(r"(\d+)", r"$_{\1}$", p.reduced_formula)                     
                    for p in d["reaction"].products if p.reduced_formula != "Zn"]

        plt.annotate(
            ", ".join(products), xy=(v + 0.05, y1 + 0.3), fontsize=90, color=colors[0]
        )
        plt.plot([x1, x2], [y1, y1], color=colors[0], linewidth=5)
    else:
        plt.plot([x1, x2], [y1, y1], "k", linewidth=3)

plt.xlim((0, 5.0))
plt.ylim((-5, 5.0))
plt.xlabel("Voltage vs Zn/Zn$^2+$ (V)")
plt.ylabel("Zn uptake per f.u.")
plt.tight_layout()


Can I take the Voltage & capacity from this calculation by any pymatgen code?
After that, how can I draw the plot of Voltage & x in ZnxCr2O4 same as bellow of this material?
Figure 1
Thank for your helping!