Dear all,
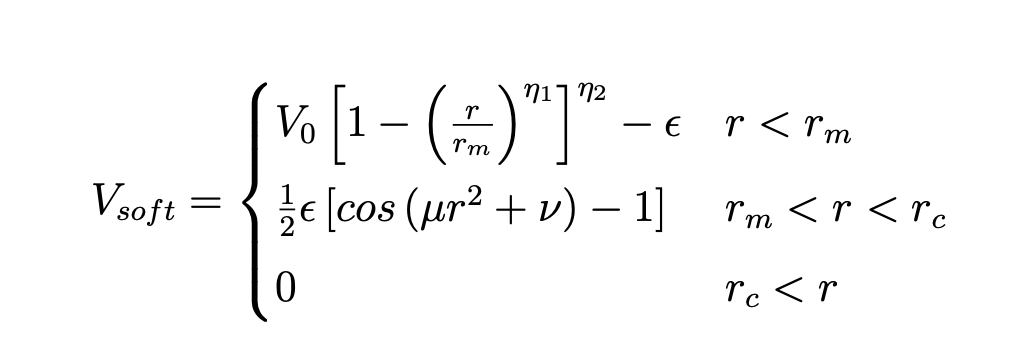
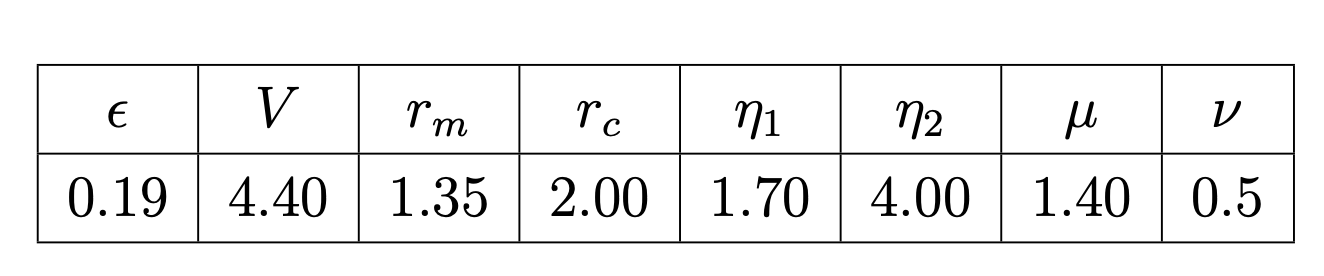
I have written a custom pair file for the potential I want to use.I have attached the potential below. To verify if I get the correct potential and force I have also written the single class in the custom writing of pair files.I have removed the multiplication by factor_lj but still I get the same result. I have checked the analytical results as well. For r<1.35 the maximum should be around 6 at around x = 0.35 but what lammps give me is maximum of around 3 at x = 0.6. I have checked the equations many time. Please help what might I be doing wrong. I am pasting the potential as well as the parameters I am using. I have the same equation in the single section but I am very perplexed what goes wrong here.
It’s likely there is a mismatch between your code and what you did in LAMMPS. But why not start with a tabulated version of the potential? Do you really need to implement a new pair style for your model? It has many parameters which is error prone at implementation. You should also provide more information such as the LAMMPS version you’re trying to implement the model in, or the actual derivation of the force you computed and coded.
Are you sure your LAMMPS input for computing the g(r) is correct?
That is a bad idea. It is needed for molecular systems.
What analytical results against what?
That is a pointless operation.
Outside of the source code for your pair style, there is nothing you provide that can help to determine where the mistake(s) is(/are).
So how did you verify the Pair::single() implementation?
Have you checked whether your derivative with respect to the distance is consistent with the potential energy using fix numdiff? same for the virial with fix numdiff/virial?
Hi,
Yes I need a new pairstyle for my model. I am using LAMMPS 2Aug 2023 version.
I have results from a previous student that I am trying to reproduce. Analytical results of the Force, what I mean to say the after the differentiation of potential w.r.t. r. I plotted the graphs in Desmos and they don’t match. They have different maximum values at different points.
What are your graphs showing then? And where is the data taken from?
Without proper legends and descriptions there is only guessing.
In general, let me remark that for a person that wants help, you are making it rather difficult to provide it with your vague and unspecific and non-reproducible statements.
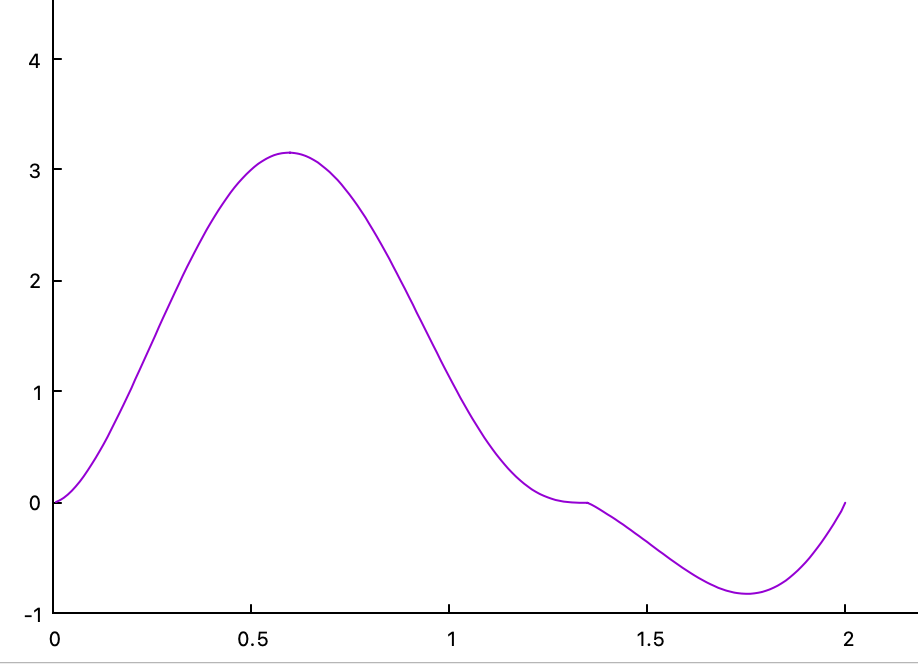
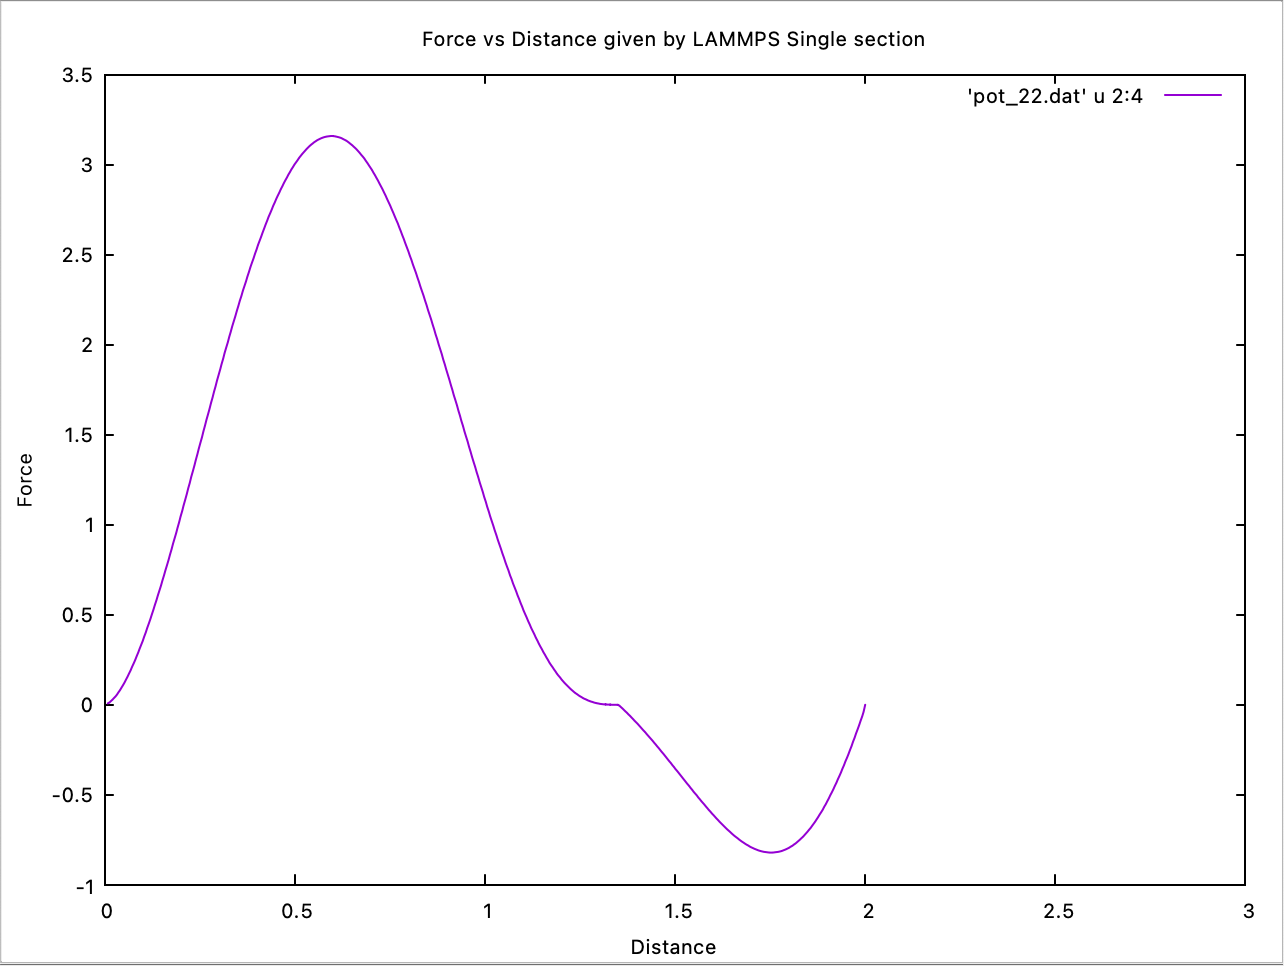
I am sorry for this. Both of these graphs are for Force vs Distance. My main issue is that why does a function gives different value when calculated in LAMMPS single section and when I plot the graph in Desmos with same parameters. The Graph below is what I get Single Section.
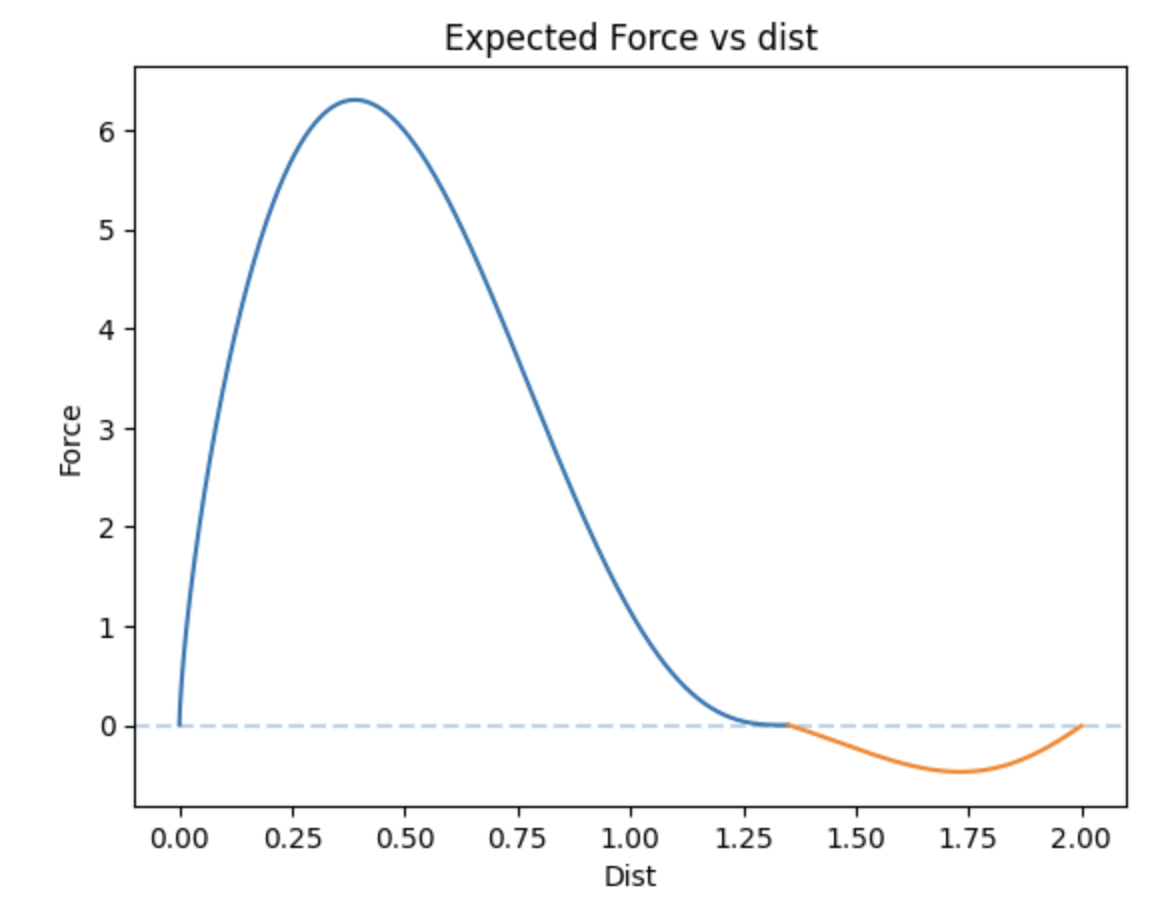
Below is the graph is what I expect to get for same function of Force. The main difference in these graphs is that one I get from pair_write gives me a different maximum value at different point. It also gives me a different minimum values
I do not see the this discrepency in Potential vs Distance Graph. I use pair_write to get back the potential and force. The only thing I have added in LAMMPS source code is the custom pair_style File that I have added. I am sorry if anything is unclear!
Naively, the “inner force” (blue line in lower graph) looks like it’s been multiplied by an extra copy of r to give the corresponding section in the purple graph.
Reasoning
See how the gradient of force is zero at r=0 in the purple graph, but nonzero in the blue graph. This could result if the purple graphed function were either the gradient of the blue graphed function, or the blue graphed function multiplied by r. But the gradient of the blue graphed function must be negative after the force maximum, so the “gradient” possibility is wrong. Picking a second point that’s easily checked manually, at r = 0.5, the blue graph is about 6 and the purple graph is about 3, which matches the “multiplied by r” hypothesis.
Beyond that it’s impossible to say without serious debugging (on which your time would be more efficiently spent than ours, since you should already know what you tried to write).
This is documented behavior. The Pair::single() function has to return force/r in a similar fashion like many “fpair” variables in Pair::compute() already contain this factor. This is a performance optimization for the fact that the computed force along the distance vector needs to be projected on the x, y, and z component via multiplication with dx/r, dy/r, and dz/r. In the case of the 12-6 Lennard-Jones potential (in combination with pre-computed factors) this allows to avoid both the square root and any divisions, which are math operations significantly more costly than addition, subtraction and multiplication.