I’ve attached my g® figure for C-C pair.
My sigma value for C is 3.5.
11.jpg<https://docs.google.com/file/d/0B-Eh0Ngt6x6_VGtZTDhReHdoUGs/edit?usp=drive_web>
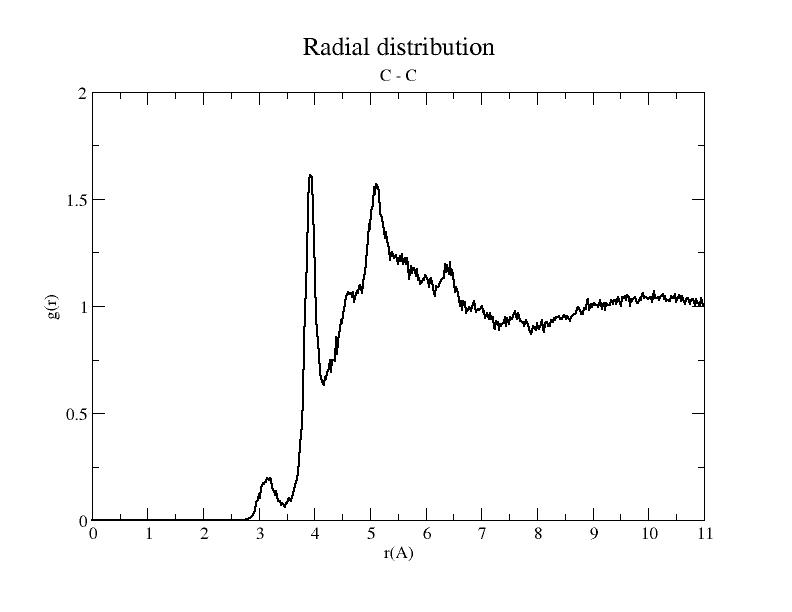
I've attached my g(r) figure for C-C pair.
My sigma value for C is 3.5.
so - trying to fill in the blanks for the last time - what you *really*
mean to say is that you have a small pre-peak in your g(r) and you don't
know how to explain it.
well, that is something that you can easily do for yourself. just check out
your trajectory data and look for pairs of atoms that are closer than those
magical 3.5 angstrom. that is fairly simple to do. i have a bit of a hunch,
but since i know nothing about your system and i don't want to lead you
into a wild goose chase, it is better, that you check it out for yourself.
axel.