Hi all!
I am currently plotting a Grand Potential Phase Diagram for a new composition, specifically “NaMnCr(CN)6,” to analyze the computed phase stabilities. I have encountered an issue while using the GrandPotentialPhaseDiagram function, which gives me a ValueError: Only 1-4 components supported!.
I came across a paper where the author successfully plotted a Grand Potential Phase Diagram involving more than four components. You can find the paper here.
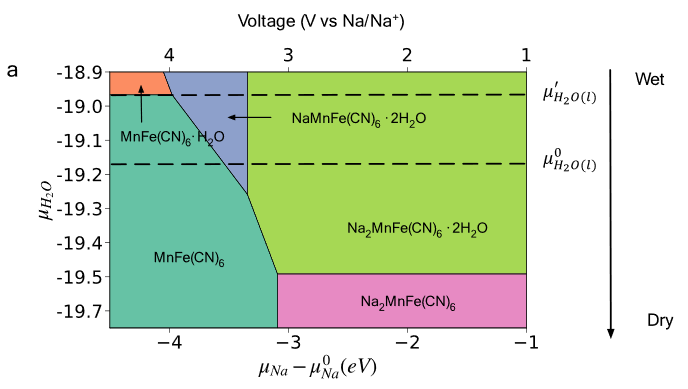
It seems that the GrandPotentialPhaseDiagram function limits the number of supported components to 1-4. Could someone provide suggestions or insights on how I can plot the Grand Potential Phase Diagram as shown below? Thank you in advance!