Dear Paul and Lammps Users,
I have been attempting to use pair_table to create a customized LJ potential. However, after I followed all the rules, and the output potential was still somehow shifted away from my input potential. I am very confused on what caused the problem, and I would really like to know how to fix it.
I attached my input distance-energy-force table and the output file generated by lammps pair_write here. I used a very simple input script basically just to test if the table potential is working exactly the way I wanted it to. I also attached it here for your full reference.
I especially wrote down the potential part command here for an easier access:
pair_style table linear 15000
pair_coeff 1 1 VK0729 Entry
pair_write 1 1 15000 rsq 0.01 2.5 vk.txt Entry
It is generated in a manner that distance is evenly distributed in the range of rsq (0.01,2.5). The energy and force is generated correspondingly at its specific distance.
I appreciate your help in advance!
Regards,
Ling
vk.txt (475 KB)
VK0729 (571 KB)
input script (722 Bytes)
If it helps, here's a picture of a graph of his input files.
(I don't know why, by the way.)
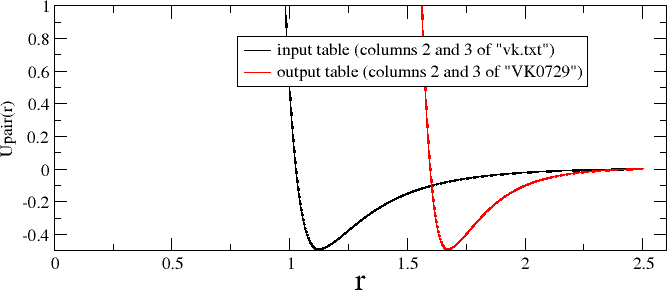
My apologies, I mislabled the black and red curves. I'm reposting the
correctly labelled plot.
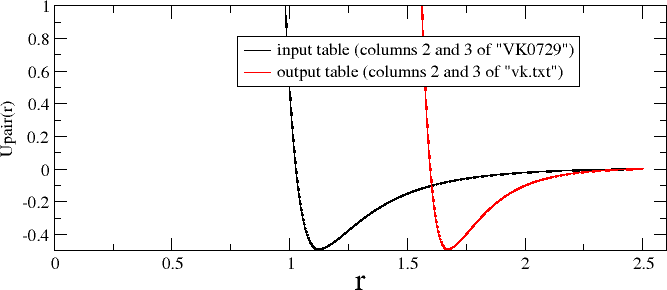
In your tabulation file (VK0729), you use the “RSQ” keyword on line 4, but give values in the table that are spaced linearly. From the manual:
http://lammps.sandia.gov/doc/pair_table.html
“If used, the parameters “R” or “RSQ” are followed by 2 values rlo and rhi. If specified, the distance associated with each energy and force value is computed from these 2 values (at high accuracy), rather than using the (low-accuracy) value listed in each line of the table. The distance values in the table file are ignored in this case. For “R”, distances uniformly spaced between rlo and rhi are computed; for “RSQ”, squared distances uniformly spaced between rlo*rlo and rhi*rhi are computed.”
So, LAMMPS is ignoring column 2 of your table. If you replace column 2 from your input table with column 2 of your vk.txt output table, you’ll see that the potential plots agree. But it would be even better if your made your tabulation file (VK0729) internally consistent.
Paul