I have read the documentation and the public examples of pymatgen-analysis-diffusion, but I have not found any code that can directly query energetic barriers from a pymatgen.analysis.diffusion.neb.full_path_mapper.MigrationGraph object. I have written a script to realize the query of the energy landscape of a diffusion pathway, but I’m not sure whether it is right.
import json
from monty.json import MontyDecoder

#read the json file
with open('649e30fc0180be6dfb677dc5_migration_graph.json') as f: #mp-26962
    data=json.load(f,cls=MontyDecoder)

#extract the energies of the insertion sites
ds=data['migration_graph']
sel=[]
sg=ds.m_graph
for s in sg.structure:
    sel.append(s.properties['insertion_energy'])

#get the migration pathways
ds.assign_cost_to_graph(cost_keys=["hop_distance"])
paths=[]

for u,path in ds.get_path():
    paths.append(path)

#show the relative energy of each site in each pathway sequentially
for c,path in enumerate(paths):
    print('-----path {}-----'.format(c))
    idxl=[path[0]['iindex']] #the starting site

  for hop in path:
    idxl.append(hop['eindex']) #subsequent site

  print(idxl) #show the site indices
  for i in idxl:
    print(sel[i]-sel[idxl[0]]) #relative energy
Many thanks, jshen and tschaume, but the provided codes are just about distances, rather than energies. I wonder whether the “Mg Cathode Screening 2022” database includes any information about the energy landscape of some materials. Materials Project - MPContribs Explorer - projects/mg_cathode_screening_2022
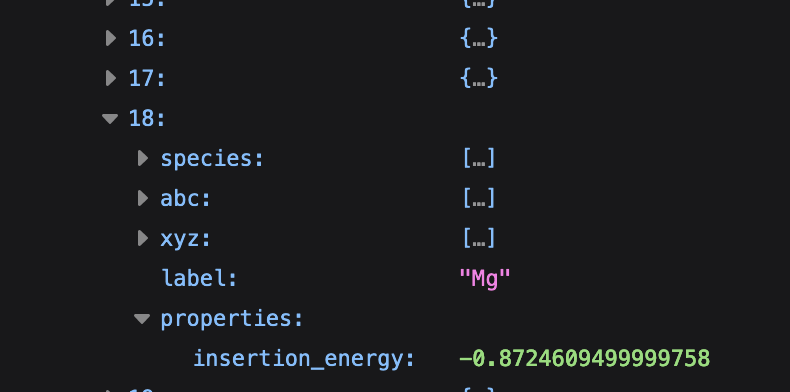
It appears that the serialized data only has the site energies and not the energy barriers.
I assume this is because the actual barriers were only calculated for a smaller subsetl
You can add the absolute value of the site energy difference to the edges of the graph and then call this function:
OK, I undstand the situation better now after reading the initial question again.
So i think what you want to do is to first loop over the hops then grab the iindex and eiindex values.
Then calculate their difference add add that as a property on the edges call it ediff or something.
Then assign that key to the cost.
Sorry for not understanding the question super clearly, it’s been a while since I looked at this.
I may have realized your idea with the following script. However, the script stuck when it tried to find the possible diffusion pathways according to the hopping energies. Maybe the problem can be attributed to the efficiency of the pathway search algorithms of pymatgen-analysis-diffusion.
import json
from monty.json import MontyDecoder

#read the json file
with open('649e30fc0180be6dfb677dc5_migration_graph.json') as f: #mp-26962
    data=json.load(f,cls=MontyDecoder)

#extract the energies of the insertion sites
ds=data['migration_graph']
sel=[]
sg=ds.m_graph
for s in sg.structure:
    sel.append(s.properties['insertion_energy'])

#get the adjacency
ginf=sg.as_dict()['graphs']
ads=ginf['adjacency']

#calculate the hop energy of each edge, and add it to the edge
for ad in ads:
  for hop in ad:
    #indices about the edge
    iidx,eidx,tji=hop['iindex'],hop['eindex'],hop['to_jimage']
    #add the property to the edge
    sg.alter_edge(iidx,eidx,tji,new_edge_properties={'hop_e':sel[eidx]-sel[iidx]})

#get the migration pathways according to the hopping energies
ds.assign_cost_to_graph(cost_keys=['hop_e'])
paths=[]

for u,path in ds.get_path(): #the script stuck here
    paths.append(path)

#show the relative energy of each site in each pathway sequentially
for c,path in enumerate(paths):
    print('-----path {}-----'.format(c))
    idxl=[path[0]['iindex']] #the starting site

  for hop in path:
    idxl.append(hop['eindex']) #subsequent site

  print(idxl) #show the site indices
  for i in idxl:
    print(sel[i]-sel[idxl[0]]) #relative energy
So the path finding is slow for very connected pathways.
Our strategy is usually to tweak the distances threshold until you get a graph that is not super well connected. I don’t have an example of such a heuristic in our open-sourced builders but you can come up with one relatively easily.