Dear All,
I have a nanotube in water and I want the nanotube to posses higher temperature than water initially. I need to plot the temperature versus time to observe the rate at which it cools off. (for all these I am using edpd method)
Here is how I do it by setting the initial velocities using velocity command. calculating per bead temperature and using compute reduce to change the temperature to a global value so I can read it via fix ave/time.
Here is my code for better reference:
units lj
dimension 3
boundary p p p
neighbor 0.2 bin
neigh_modify every 1 delay 0 check yes
neigh_modify one 1500
atom_style hybrid edpd full
bond_style harmonic
angle_style harmonic
pair_style edpd 1.58 9872598
region mybox block -15 15 -15 15 -15 15 units box
read_data myfileaxis.data
create_atoms 2 random 16000 276438 NULL
include parmcnt.lammps
bond_coeff 1 2000 0.77
bond_coeff 2 180 1.9607888988921507
#GROUPING
group CNT type 1
group liquid type 2
#set atom * edpd/temp 1.0
#APPROXIMATE HEAT CAPACITY FOR CNT AND WATER
set atom 1 edpd/cv 0.2E5
set atom 2 edpd/cv 1.0E5
comm_modify vel yes cutoff 5
#RECENTER THE CNT
variable CNT_xcm equal -1xcm(CNT,x)
variable CNT_ycm equal -1xcm(CNT,y)
variable CNT_zcm equal -1*xcm(CNT,z)
displace_atoms CNT move {CNT_xcm} {CNT_ycm} ${CNT_zcm}
#CHANGE BOX BOUNDARIES
change_box all x final -15 15 y final -15 15 z final -15 15
#PRINT ATOM COORDINATES EVERY 1000 STEPS
dump mydmp all atom 1000 dump.lammpstrj
#SETTING INITIAL VELOCITIES/TEMPERATURES FOR CNT AND WATER
velocity liquid create 0.9 432982 loop local dist gaussian
velocity CNT create 2 432982 loop local dist gaussian
#MOLECULAR DYNAMICS
compute mythermo all temp
thermo 100
thermo_modify temp mythermo
thermo_modify flush yes
###(updates the per-atom temperature, in addition to position and velocity, and must be used with ########the pair_style edpd command)
fix mvv all mvv/edpd 0.5
#OUTPUT TEMPERATURE PER TIMESTEP
compute temp CNT edpd/temp/atom
compute alltemp CNT reduce max c_temp
fix tmppertim CNT ave/time 1 50 50 c_alltemp file tempcnt1.profile
thermo_style custom step temp etotal c_alltemp
timestep 0.01
run 10000
The plot I am getting is:
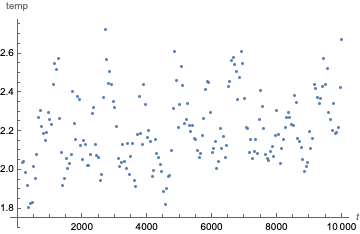
but this nowhere near cooling off. could you please help me understand what I am doing wrong? is outputting the wrong data or basically the way I am initializing the velocities and let the system reach equilibrium?
Thank you so much