Dear lammps users
I have a lammps data file which is an output of simulation of cells
flow in a tube. It contains cells, represented by atoms, bonds,
angles, and dihedrals. The simulation domain is {-7 7, -7 7, -35 35}.
I want to visualize this data somehow, the only program I know can do
that is VMD.
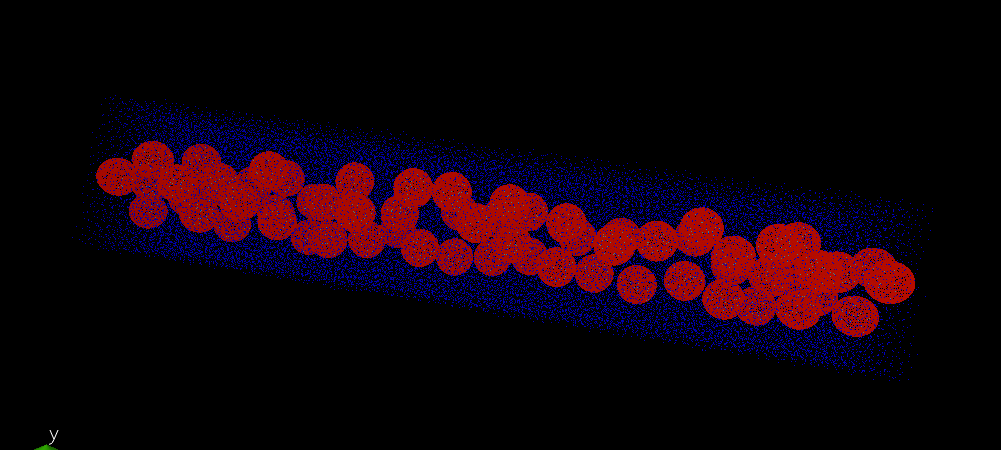
When I load it to the VMD it looks weird (to illustrate it, I attached
screenshot) because of periodicity and I can’t sort it out because
don’t understand several things:
1) How VMD transforms lammps coordinates into it’s own? For instance,
I found that coordinate of the point near the center of my simultaion
box (picked a point in VMD) is like {-7174 -7168 -35823}.
2) As far as I understood in order to do wrap correctly I need to
specify unitcell. I can do that using set command: pbc set {14 14 70}.
But this command specifies size of the box only, is it enough to
specify periodic domain? Don’t I need to specify center of the domain
as well (the point, not center of mass)?
3) Do I need to apply wrap several times if particles are far away
from the original box?
To load lammps data file, I use the following command
topo readlammpsdata <filename> molecualr
pbc set {14 14 70}
pbc wrap
wrap changes the picture but it is still weird. In order to illustrate
how it the data should look like I attached before.png file - it is
rendered input data file for the simulation (all points are inside box
at this point).

