Hii users
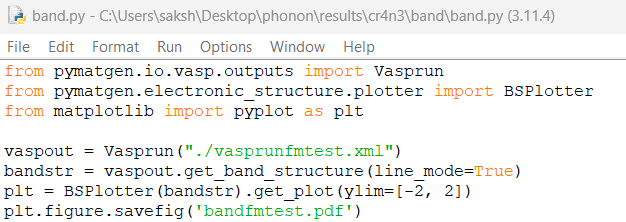
I had a script attached below to plot bandstructure. I want to change the color of the band line and legend and line type. could anyone please help me how to add these things in the script?
Hi again.
This is more a matplotlib related question. The variable plt contains a matplotlib object with all the details of the plot that can be edited.
For example, you can change some defaults in the rcParams
import matplotlib.pyplot as plt
plt.rcParams["legend.fontsize"] = 30
bsp = BSPlotter(bs).get_plot()
or edit the plot after is created:
ax = bsp.gca()
ax.lines[0].set_color("red")
Please, check out the matplotlib website or the uncountable tutorials online.
Hope this helps,
FR
Thank you again ![]()