hello everyone:
i recently have used fix bond/create command to create some new bond between certain atoms. I have to visualize the newly created bonds to verify the correctness by this command.
As the Manual and related mail said, i successfully got pure text file of the bond info using commpute property/local and dump local commands.
ITEM: TIMESTEP
200025
ITEM: NUMBER OF ENTRIES
555
ITEM: BOX BOUNDS pp pp pp
0.786978 23.252
1.57174 24.0368
-0.690377 21.7746
ITEM: ENTRIES c_1[1] c_1[2] c_1[3]
1 162 163
3 162 186
1 163 164
……
But the question is how can i visualize this file by Dump local(can't directly open by VMD)?What else i have to do? What other file or command shall i use?
Thanks,everyone!
Kang Jingtian
hello everyone:
i recently have used fix bond/create command to create some new bond between certain atoms. I have to visualize the newly created bonds to verify the correctness by this command.
As the Manual and related mail said, i successfully got pure text file of the bond info using commpute property/local and dump local commands.
ITEM: TIMESTEP
200025
ITEM: NUMBER OF ENTRIES
555
ITEM: BOX BOUNDS pp pp pp
0.786978 23.252
1.57174 24.0368
-0.690377 21.7746
ITEM: ENTRIES c_1[1] c_1[2] c_1[3]
1 162 163
3 162 186
1 163 164
……
But the question is how can i visualize this file by Dump local(can't directly open by VMD)?
no. VMD doesn't know how to hand such files and doesn't even have
"native" support for varying bonds (except for its own purely distance
based "dynamic bond" representation.
that being said, it is possible to modify the bond topology and update
the display accordingly, but that would have to be programmed in Tcl
(or python) scripting and you'd have to write your own parser and
maintain the connection data and then attache a hook into the display
update loop of VMD to update the bond information. i have done such
things in the past, e.g. to visualize hydration shells for ions. not
impossible, but not trivial either. it requires decent programming
skills and some reading through the VMD and Tcl documentation,
experimentation, and reviewing other solutions to parts of the
problem.
e.g. you can use the topotools plugin to simplify the management and
application of the bond information data.
axel.
If you have not run the simulation yet, then you can use the
"write_data" command to generate a long list of data files. Each of
those data files can be read using VMD and visualized using standard
toptools commands.
(You can use VMD's Tk Console window, or invoke VMD using the "-e"
argument, to load a file containing TCL commands which tell VMD to
read each data file, using topotools readlammpsdata command, render
the system, and delete the molecule, and repeat.)
If you have already run the simulation, then that is a different
story. Currently, "read_dump" does not know how to interpret the bond
information in your dump files. (Although this is not what Axel was
proposing, I initially thought you could use a combination of
"read_dump" and "write_data" commands in a lammps post-processing
script, but I don't think this will work.)
i recently have used fix bond/create command to create some new bond between certain atoms.
i successfully got pure text file of the bond info using commpute property/local and dump local commands.
ITEM: TIMESTEP
200025
ITEM: ENTRIES c_1[1] c_1[2] c_1[3]
1 162 163
3 162 186
1 163 164
……
It's too bad the column names are "c_1[1]", "c_1[2]", etc... If they
had more descriptive names, it would be easier to write general code
to parse these kinds of dump files.
But the question is how can i visualize this file by Dump local(can't directly open by VMD)?
no. VMD doesn't know how to hand such files and doesn't even have
"native" support for varying bonds (except for its own purely distance
based "dynamic bond" representation.
Other visualization programs (chimera) have this limitation as well.
Several posts have been made on this topic over the years, including
recommendations to use PARAVIEW, VTK, BLENDER, and "dump_image". Here
are a few links:
http://lammps.sandia.gov/threads/msg03607.html
Hopefully I'll be running these kinds of simulations soon. I'll post
any solutions I find. I might also take a look at what pymol can do.
Cheers
Andrew
hello,Axel and everyone
Just as you told me,i use the write_data command to output the topo imformation and vizuialize it using VMD by "topo readlammpsdata ****.data "
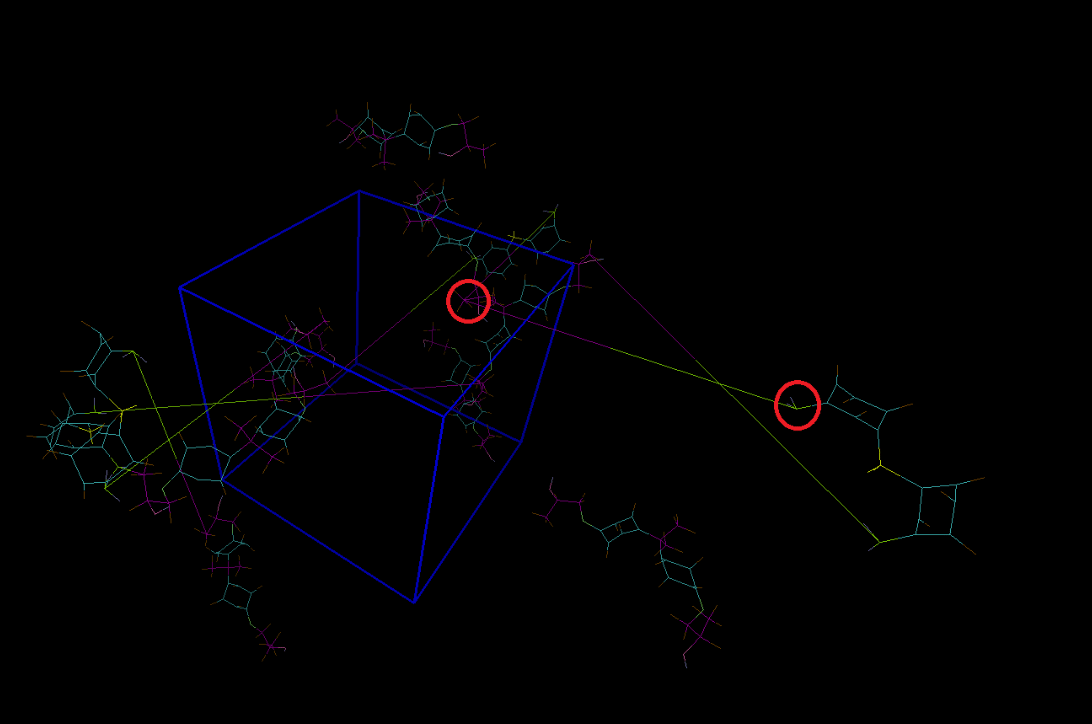
However,the image for my system looks strange. The newly created bonds is too long.
I think it because the "p p p" bondary condition ,rather than a wrong cutoff distance.
The molecule outside the unitcell should stay within the box from opposite side.
However "write_data" gave the initial molecule coord.
How to modify it to make it looks reasonable?
Thanks
Kang Jingtian

Have a look at the pbctools plugin in VMD. Try commands like pbc unwrap / join.
Good luck,
Wei
