Hello,
I am trying to use the pymatgen PhaseDiagram and PDPlotter modules to plot a ternary convex hull for a system, and I am running into some problems that I cannot explain.
As a test case, I am trying to reproduce the Y-Ag-In ternary phase diagram from data available in the Materials Project. The result of a materials project search in this system yields a phase diagram with 13 phases on the convex hull, including the ternary YAg2In (sorry I can’t post a picture, I am limited to one image per post, but you can create the diagram at this link: https://materialsproject.org/#apps/phasediagram/).
However, if I copy these data into an excel spreadsheet, and read them in and plot them using pymatgen, I end up with a completely different looking phase diagram (code and result below):
from pymatgen import Composition
import pandas as pd
import pymatgen as mg
import numpy as np
from pymatgen.analysis.phase_diagram import PhaseDiagram, PDPlotter, PDEntry, Element

df = pd.read_excel('Ag-In-Y_ternaryPD.xlsx')

comps = df['Composition']
Ef=df['Value']

mg_comp=[None]*len(comps)
for i in range(len(comps)):
    mg_comp[i]=Composition(comps[i])

from pymatgen.entries import  computed_entries

entries3=[None]*len(mg_comp)
for i in range(len(mg_comp)):
    entries3[i]=PDEntry(composition=mg_comp[i], energy=Ef[i])

pd3 = PhaseDiagram(entries3)

%matplotlib inline

plotter = PDPlotter(pd3, show_unstable=False)
plotter.show()
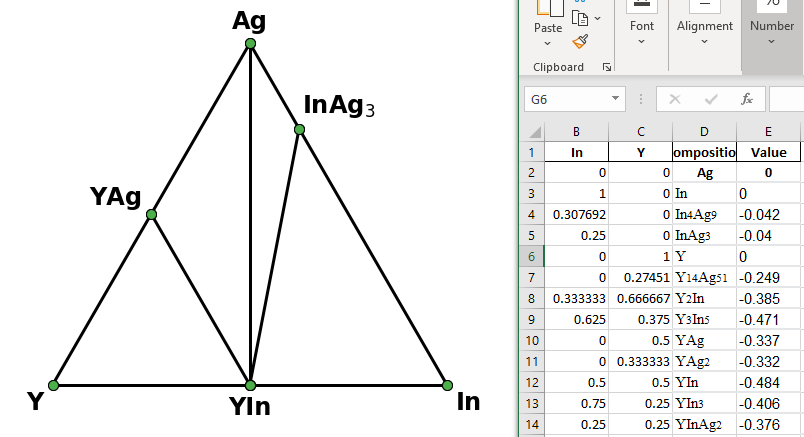
where I have also screenshotted the spreadhseet ‘Ag-In-Y_ternaryPD.xlsx’ containing the stable phases as listed by the MP.
I also found that when looking specifically at the Y-In binary phase diagram generated from the MP data points, there are more convex hull points than just YIn (as is found by pymatgen):
I do not understand if there is an error in my code that is causing this problem, or if there is some flaw in the way that pymatgen computes the convex hull. Please let me know if you have any ideas, thank you!
Gordon