I am recreating the amorphous carbon creation phases from this paper (see Fig. 1). As I plot the temperature over time for each phase on a semi-log plot, I’m running into an issue where the amplitude of the temperature fluctuations increase over time in the third phase during equilibrium. I am following the same parameters outlined in the paper – using the csvr thermostat fix and the same temperature, time, damping, etc. as listed. I am using the Tersoff potential since it is readily available with OpenKIM.
Here is my input script for the third (annealing) phase:
#Third stage of creation of a-C: annealing – Tersoff
#Define potential
kim_init Tersoff_LAMMPS_Tersoff_1988_C__MO_579868029681_003 metalboundary p p p
#read in (temp, position) data from second step file
read_data data.a-carbon-tersoff-step2kim_interactions C
#Variables
variable tstep_anneal equal 0.0002 # ps
variable time_anneal equal 400 # ps
variable temp_anneal equal 5000 # K
variable temp_damp equal 0.1 # ps (CSVR thermostat relaxation constant)
variable nsteps_anneal equal {time_anneal}/{tstep_anneal}#set nve fix
fix 1 all nve#Annealing
fix 7 all temp/csvr {temp_anneal} {temp_anneal} ${temp_damp} 10#generate curve with instantaneous temperature
variable temp equal temp
fix 8 all ave/time 1 1 1 v_temp ave one file ac_temp_step3.curve#set frequency of output
thermo 100#output configuration
dump mycrystal all atom 100 ac_step3.dumprun ${nsteps_anneal}
#write out final status of simulation
write_data data.a-carbon-tersoff-step3
Here is the plot generated from ac_temp_step3.curve:
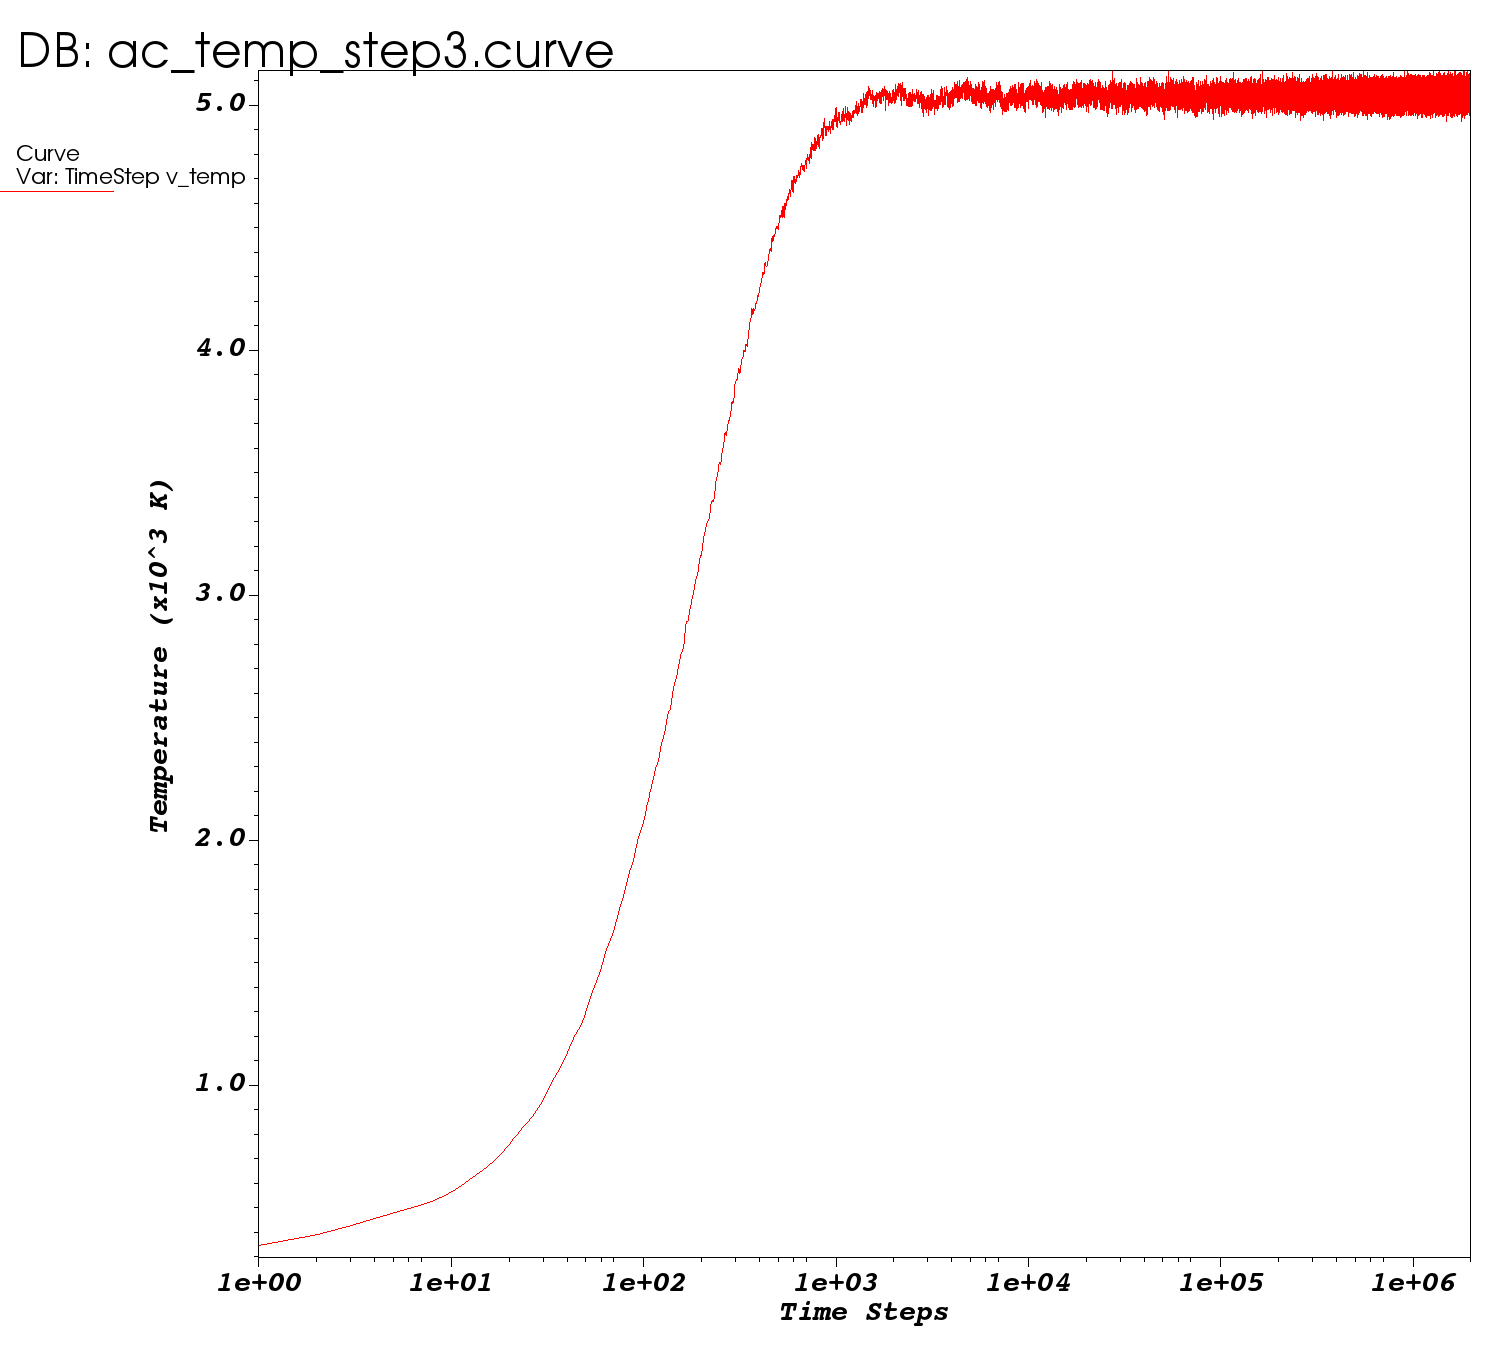
I expect to see constant fluctuations over time, so I’m not sure what is causing this growth behavior. I also looked at the ‘econserve’ variable as I expected this to be constant using this csvr fix, but this variable increased linearly over time. Any thoughts are appreciated.