Dear Dr. Steve Plimpton and LAMMPS Users,
Thank you, Dr. Plimpton for your advice.
I was curious if I could ask a question regarding the compute bond/local command.
I am currently studying the force-displacement response of a polymer strand in a freely jointed chain where I define polymer strand as the polymer chain segment flanked by two crosslinks.
I have created a simple polymer matrix consisting 4 chains each comprised of 10 beads. There are 5 crosslink bonds that link these different chains. The bonds that connect to form a chain and the crosslink bonds are governed by FENE potential and non-connected beads interact with LJ potential.
I have applied uniaxial deformation such that the simulation box elongates to twice its original box length (stretch = 2.0) at strain rate of 0.00001 in LJ units.
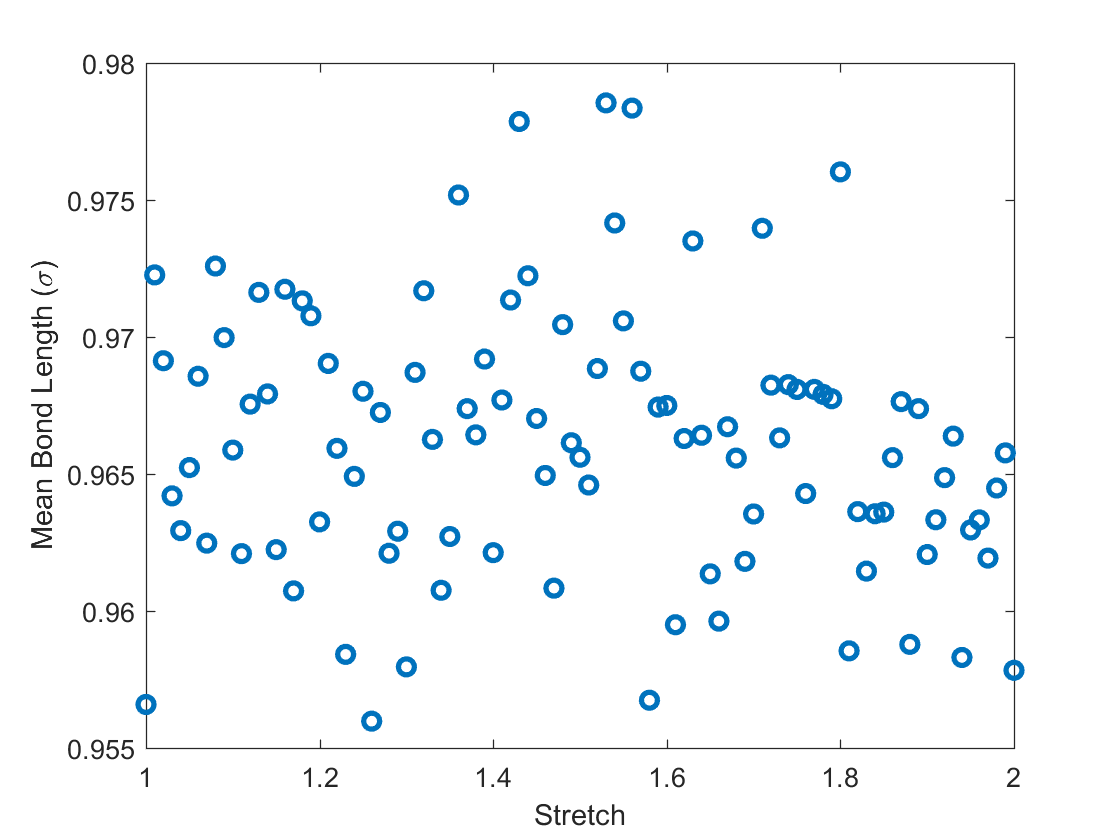
However, I have plotted (and attached) the average bond lengths for the 4 chains with respect to stretch, and I am observing a random fluctuation without any signs of upward trend. I am expecting that the average bond length of the 4 chains should increase with respect to increasing stretch.
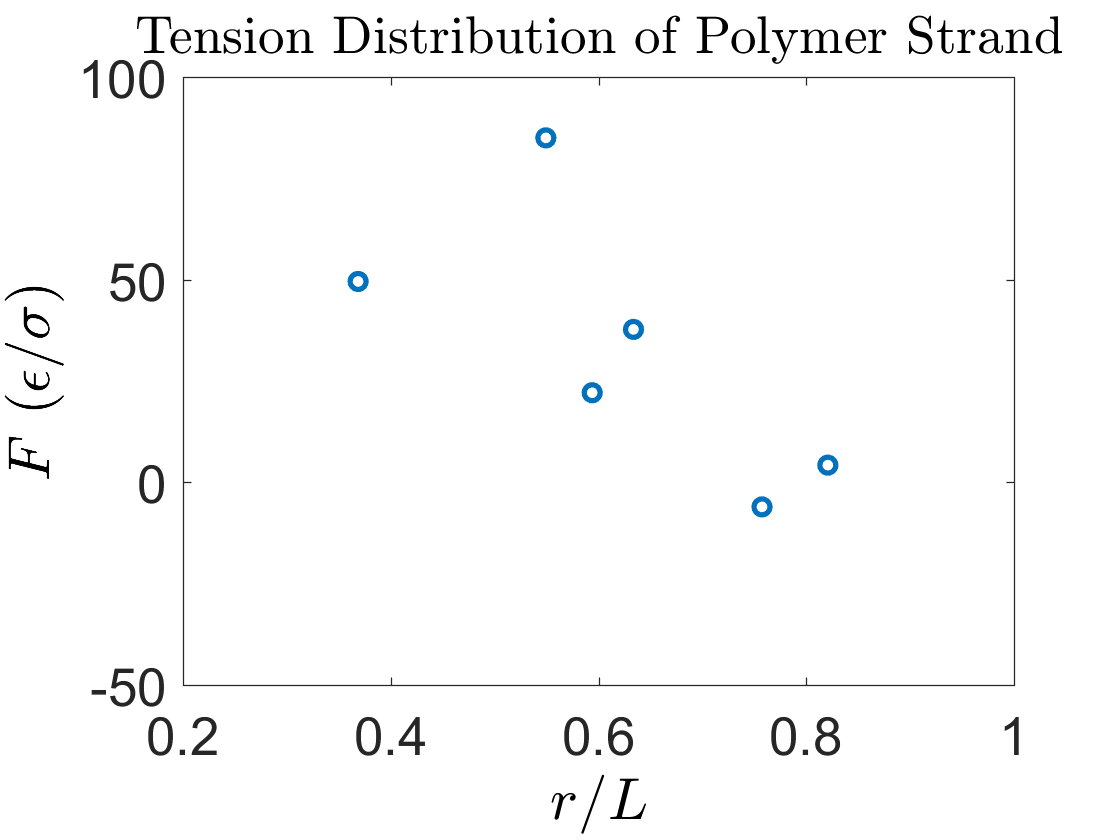
Furthermore, I have plotted (and attached) the tension experienced by polymer strand at maximum elongation (stretch = 2.0) and the strand tension varies randomly with respect to r/L (strand end-to-end distance/strand contour length).
In both of these plots, I should see an upward trend, and I should not see data points in the negative region of the force plot since this would imply bonds being compressed when in fact the simulation box is elongating.
I tried with larger stretch but I am continuing to see random pattern in these plots.
Following the documentation, I understand that compute bond/local calculates the bond length, bond potential and bond force between every atom, but I was curious if I am interpreting and using the compute bond incorrectly. Simulating a larger polymer matrix, I am obtaining reasonable stress strain curve, but I am still seeing random fluctuation in bond length and force as well as in strand tension.
According to the documentation and from physical interpretation, I should see an upward trend in both of the attached plots. I would greatly appreciate if I could request for any comments or advice.
I also attached my LAMMPS script and the external data file if needed. Thank you so much for your time.
Sincerely,
Masato Koizumi
0.10553_rho (7.21 KB)
Stress_Strain.in (1.6 KB)