I am conducting a simulation of an iron plate, maintaining a constant temperature at 353.0 K using the Nose-Hoover thermostat (fix 1 plate nvt temp 353.0 353.0 1.0). However, when visualizing the results in OVITO, the plate appears to be melting at a relatively low temperature. Although the temp profile shows the constant temp around 353 K.
(1) Are there alternative methods or checks to confirm whether the plate is genuinely melting? (2) If melting is occurring, what could be the possible reasons for it happening at a lower temperature?
I have using potential parameters from previous literature (Fe_2.eam.fs).
So, your initial particle positions are consistent with the thermodynamically stable structure of iron at your conditions?
If you want an order parameter, have a look at translational order parameter.
And honestly, these are not questions about LAMMPS but more a matter of debate with your supervisor.
“Appears to be melting” is not a scientific description of simulation results. A simple check is to calculate particles’ MSD over time, which increases steadily in fluidic phases and stays roughly constant (or increases in jumps) in solid phases.
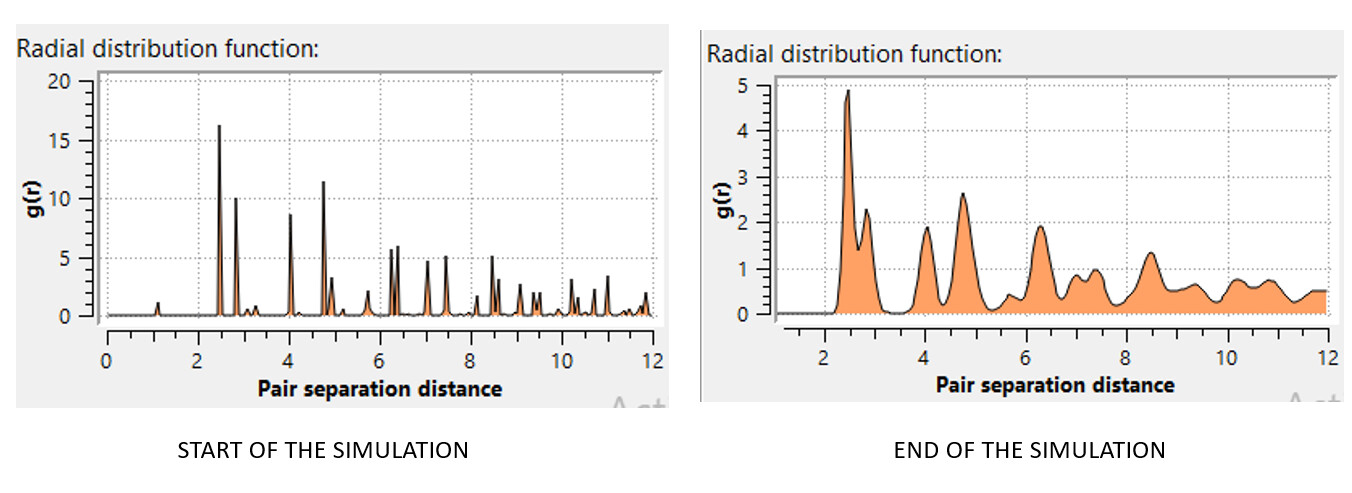
I believe that the RDF plot might fulfill the same purpose you’ve mentioned. Please take a look at the RDF images (coordination analysis from OVITO), please provide insights or corrections if I am wrong.
This doesnt seem to be melted (in my opinion) from looking at the RDF. The equilibrium relative spacing between pairs is somewhat the same in the left and right hand side. I think the peaks are merely broader (should occur if the data in the right hand side concerns a larger temperature than in the left hand side).
Maybe checking the msd as Shern suggested would be a good idea
The plate is not melting. Not at all. As can be clearly seen from the visualization. The problem is that you have a periodic system in x- and y- direction but your iron plate is not commensurate with that.
The core lines of your input related to that are here:
create_box 1 whole

#Step2: subtract plate
lattice bcc 2.87 orient x 1 0 0 orient y 0 1 0 orient z 0 0 1
region plate block 0 70 0 70 0 10
create_atoms 1 region plate
group  plate region plate
set region plate type 1
First you create a 70x70x10 Angstrom box. Using “units lattice” and “side in” has no impact since at that point there is no lattice defined and a simulation box has no “in” or “out”.
Then you define a lattice which now changes the lattice unit from 1.0 Angstrom to 2.87 Angstrom.
Thus when you define your region “plate” that region is 200.9x200.9x28.7 Angstrom large. When you create the atoms they are created in the intersection of the box and this region and as a consequence the iron lattice is not properly continued across the periodic boundaries. This is reflected in the crazy large pressure you are seeing initially. This would be different, if you define the lattice before creating the simulation box and use suitable integer box dimensions. Your choice of 70 Angstrom is about 24.4 lattice spacings, so either use 24 or 25 lattice spacings for 68.88 or 71.75 Angstrom which are commensurate with the 2.87 lattice. So by choosing 70 Angstroms you chose a dimension that is almost in the middle between the two optimal choices.
Apart from that, there are lots of redundant or meaningless commands (e.g. a run without a time integration fix, computes that represent computations already created by the thermo output and so on).