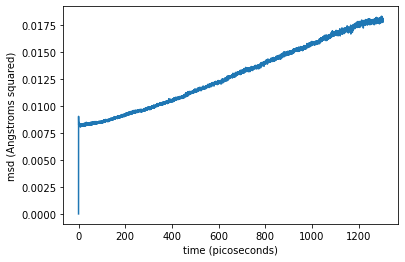
I’ve been attempting to replicate some published results on Iron self-diffusion by running MD simulation in Lammps on an iron lattice with vacancies and plotting the mean square displacement. I am puzzled as to why when I plot the data I see a large jump at the first timestep followed by more expected behavior (becoming more linear after a long time).
My input script is as follows:
Define variables
variable T equal 350
units metal
dimension 3
boundary p p p
atom_style atomic
neigh_modify delay 0 every 1
Define Structure
Structure is a bcc iron lattice with vacancies
created in atomsk with name data.diff_Fe.lmp
read_data data.diff_Fe.lmp
pair_style meam
pair_coeff * * library.meam Fe Fe.meam Fe
mass 1 55.845
reset_timestep 0
minimize 1.0e-6 1.0e-6 100 1000
fix 1 all box/relax iso 1.0 vmax 0.1
run 10000
reset_timestep 0
unfix 1
Equilibration Run
fix 2 all npt temp $T $T 100.0 iso 1.0 1.0 1000.0
thermo 100
run 100000
unfix 2
####### Data Gathering ##############################################
velocity all create $T 91897
fix 3 all nvt temp $T T 100.0 group fe type 1 compute msd all msd com yes average yes fix 9 all vector 10 c_msd[4] variable D equal slope(f_9)/6/(dt) variable msdsc equal c_msd[4] fix 7 all print 100 "{msds}" file Femsd.txt
compute velocity autocorrelation function
compute 2 all vacf
fix 15 all ave/time 500 1 5000 c_2[4] file vacfavg.txt
fix 5 all vector 1 c_2[4]
variable vacf4 equal c_2[4]
fix print to output data
fix 14 all print 100 “${vacf4}” file vacf4.txt
thermo_style custom step temp c_msd[4]
fix 8 all print 1000 “${D}” file D.txt
thermo 100
run 2000000