Dear Eric,
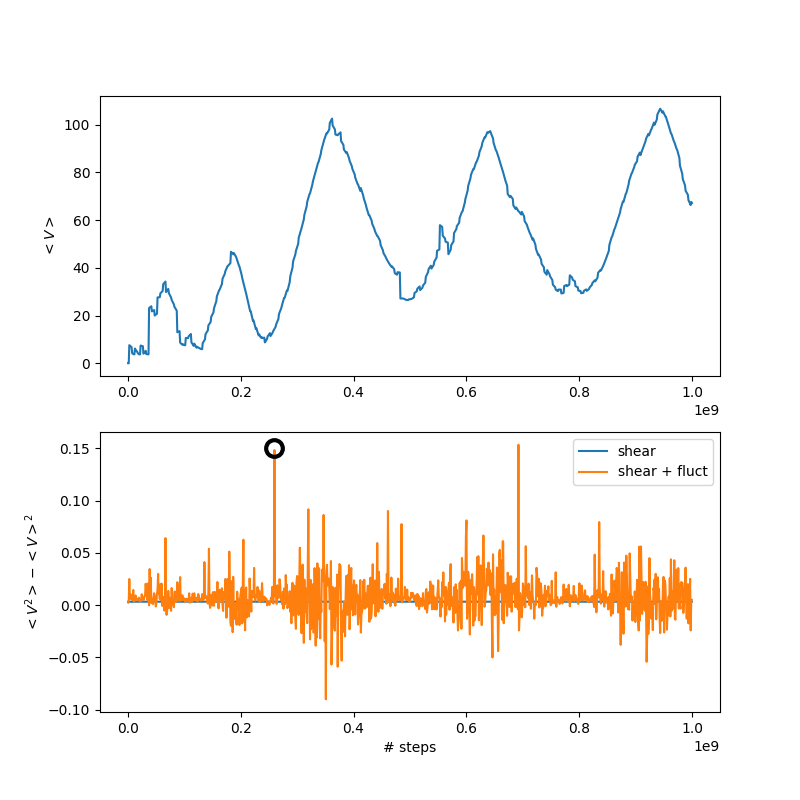
in the attached figures you can see the evolution of the average velocity, and of an estimate the fluctuations ( <V^2> - <V>^2 computed for each output step ) (the contribution due to shear is also shown).
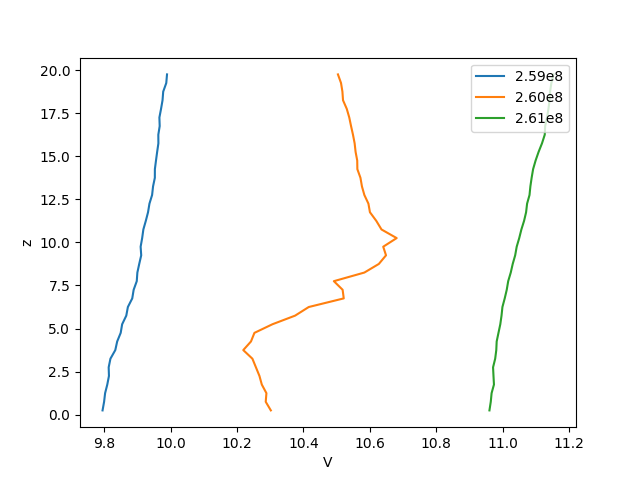
I also attach velocity profiles around one peak of fluctuations highlighted in the first figure.
I computed these using dump files. It's true that the profile displays at times a sort of shear band in the middle. Maybe it is this which ratchets up the average velocity.
Is there something wrong with my input script ? Is there a way to avoid shear banding ?
I thought that with Parrinello & Rahman scheme there were no sliding boundary images...
I attach the full input, and the initial data file, just in case (sorry if double posting, I had a problem while sending)
Thanks,
Riccardo
You are correct in fix deform the boundary images do not move, rather the box deforms but things remain periodic. It would be more accurate to say that the velocity jump imposed on particles that cross the boundary in the direction of shear can cause shear banding. This is because there is only a subset of positions where momentum is input into the system - which can induce inhomogeneity in the velocity field(shear banding) especially when things get really dense. Your yellow plot of the mean velocity looks even stranger than that though - a large portion of the system is experiencing shear in the opposite direction that you are forcing. This is also quite transient, not even last for a full shear strain.
Would you sharing your entire input - particularly how you are outputting statistics? I don’t see how you can get negative instantaneous granular temperature in your second plot.
My hunch is that your shearing things too fast/particles are too hard, so that in some situations the particle assemblies might not have time to relax. Though from your notes it looks like your time step should be sufficient to capture overlap dynamics. Outputting the maximum overlaps might be of some aid. On the other hand, you could just soften up your particles by a couple orders of magnitude, and see if it goes away - that will tell you a lot. From a back of the envelope calc, you’re doing something like 1 mm fused silica at 10 s^-1. Doing something closer to rubber is faster, so it might be a good way to diagnose.
Couldn’t find anything wrong with the script per se.
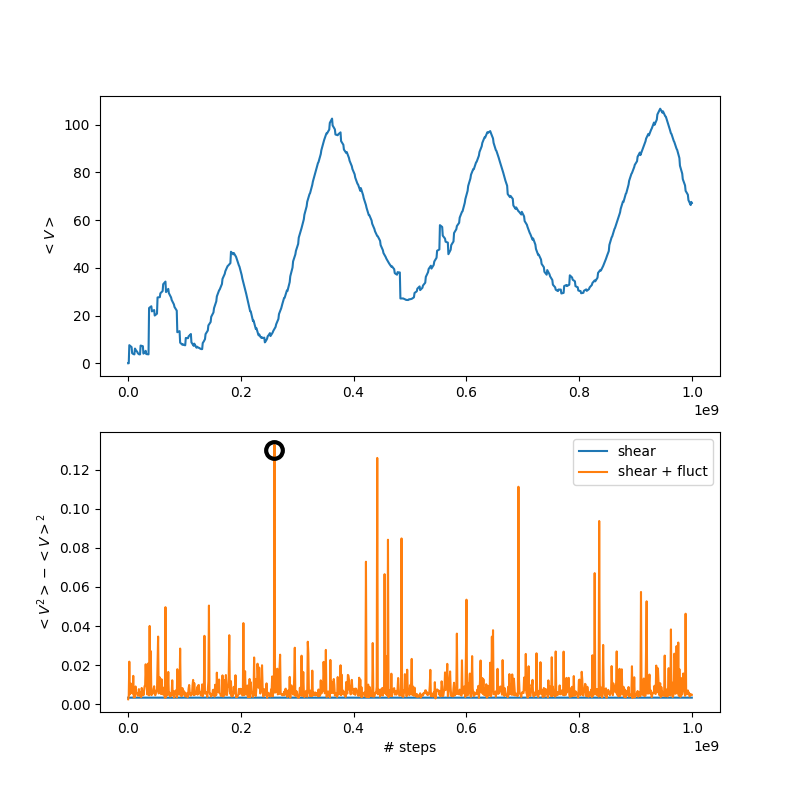
For the statistics, you’re right the granular temperature cannot be negative; there was an error in the python script I made for visualizing the problem.
now it computes - for each snapshot
where vx, vy, vz and z are particle velocities and z coordinates taken from dump files.
SV2 is the contribution to <V²> - ² from the shear deformation.
I attach the updated figure.
Thank you for your suggestions, I will check the overlaps and see what happens when softening the particles.
Riccardo