I have recently tested the replica package provided in the LAMMPs source code and have successfully run the neb example to obtain 3 “screen” files, and 3 log files which seems to match nicely with the expected outputs:
log.neb.hop2.1Feb14.linux.4
log.neb.hop1.1Feb14.linux.4
log.neb.sivac.1Feb14.linux.3
I subsequently followed the README prompts to use the python toolkit commands:
python {LAMMPs}/tools/python/neb_combine.py -o dump.hop1.combine
-b dump.nonneb.1
-r dump.neb.*
python {LAMMPs}/tools/python/neb_final.py -o dump.hop1.final
-b dump.nonneb.1
-r dump.neb.*
This produced 3 dump files, which are not named in accordance with the readme file… they are named:
dump.neb.sivac.1
dump.neb.sivac.2
dump.neb.sivac.3
I have been attempting to visualise these dumpfiles with the python kit, but have found the documentation for Pizza.py very disorienting…
Could you possibly indicate the best way for me to achieve this, and potentially, if you understand the neb tool, could you indicate how the output files indicate the MEP, and/or how to determine the activation volume from such an output?
I have attached the output files I obtained.
Thanks for your consideration!

dump.neb.sivac.1 (1.31 KB)
dump.neb.sivac.2 (1.31 KB)
dump.neb.sivac.3 (1.32 KB)
log.lammps.1 (6.27 KB)
log.lammps.2 (6.27 KB)
log.lammps.3 (5.44 KB)
screen.1 (4.3 KB)
screen.2 (4.3 KB)
screen.3 (4.4 KB)
[...]
I* have been attempting to visualise these dumpfiles with the python kit,
but have found the documentation for Pizza.py very disorienting...*
that probably means, that you have to obtain a bit more orientation in
python and its packages. but be it as it may, there are alternatives. the
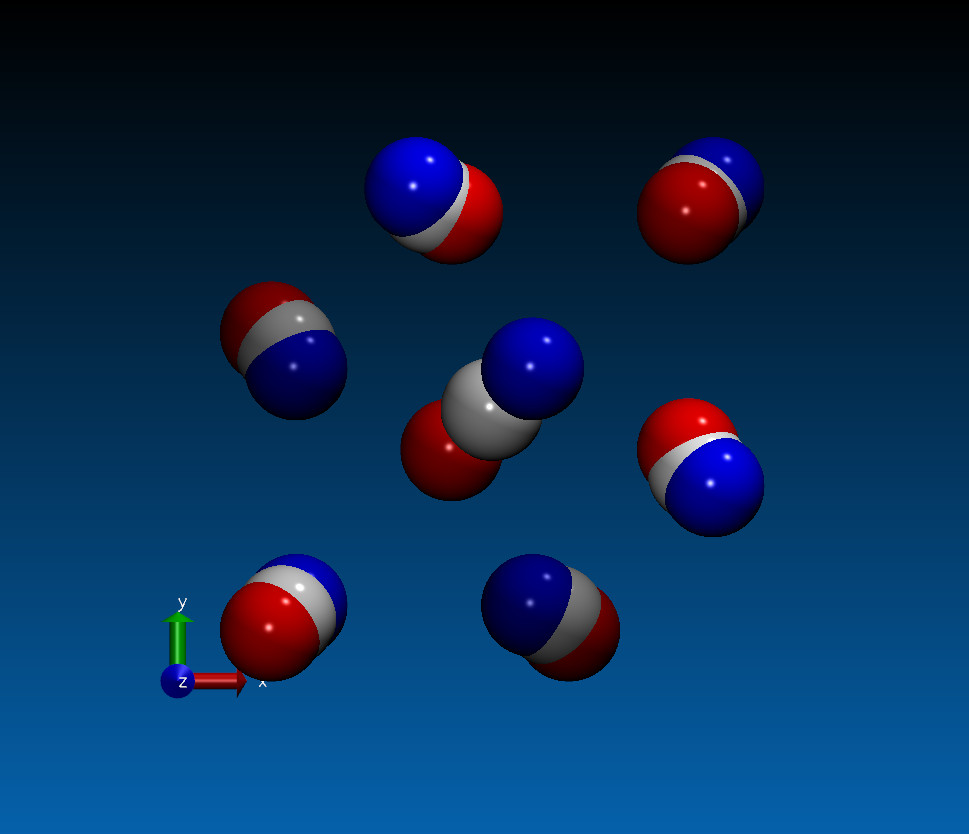
LAMMPS dumpfiles can be read by VMD. if you load each in a separate
"molecule" and color them individually (e.g. blue, white, and red) you can
get a visualization like the attached one.
Could you possibly indicate the best way for me to achieve this, and
potentially, if you understand the neb tool, could you indicate how the
output files indicate the MEP, and/or how to determine the activation
volume from such an output?
i don't know NEB myself very well, but generally it is better to first
figure out by yourself, how you can determine these properties from a NEB
calculation at all, and then try to make sense of what the tools do.
postprocessing tools are generally very simple, so they should be simple to
understand and - if needed - easy to modify for your specific needs.
axel.
Thanks Axel,
Do you obtain an activation energy (or energy barrier) of 2210.289 eV? That was the outcome I evaluated from the original log outputs.
For my own outputs, I get 2210.2885 eV (Essentially exactly the same).
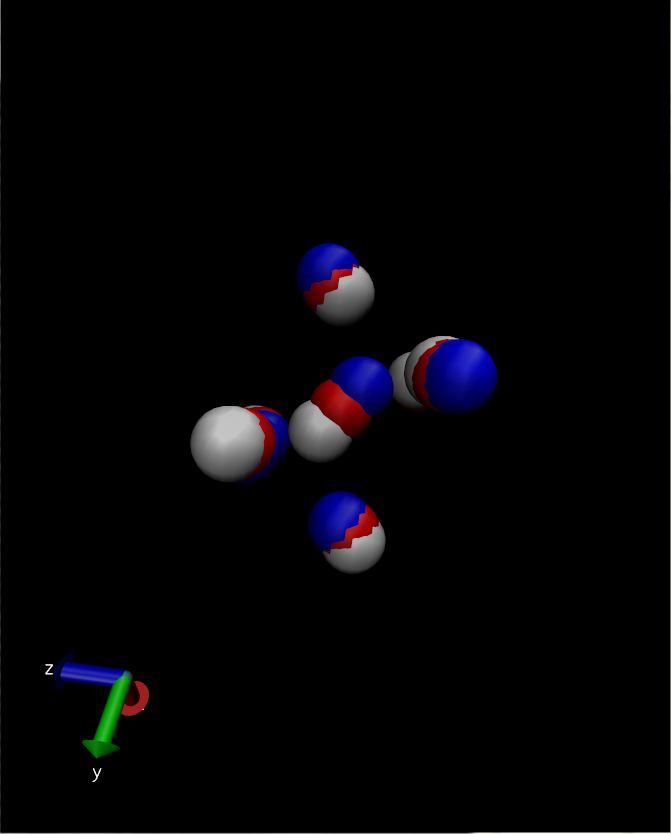
Also, I am uncertain how to obtain the final configuration with VMD - I have finally succeeded in obtaining some kind of output (attached).\
Clearly, my output is quite different from yours…?
Thanks very much!
Thanks Axel,
Do you obtain an activation energy (or energy barrier) of 2210.289 eV? That was the outcome I evaluated from the original log outputs.
For my own outputs, I get 2210.2885 eV (Essentially exactly the same).
I already said that I don’t know much about NEB, and i don’t care.
Also, I am uncertain how to obtain the final configuration with VMD - I have finally succeeded in obtaining some kind of output (attached).\
I don’t understand this question.
Clearly, my output is quite different from yours…?
Is it? How? It is the same data. To learn about different visualizations, you have to read the vmd user’s guide and practice. I’m using vmd for over 15 years, so i have picked up a trick or two during that time. 
This is from the neb doc page:
There are 2 Python scripts provided in the tools/python directory, neb_combine.py and neb_final.py, which are useful in analyzing output from a NEB calculation. Assume a NEB simulation with M replicas, and the NEB atoms labelled with a specific atom type.
The neb_combine.py script extracts atom coords for the NEB atoms from all M dump files and creates a single dump file where each snapshot contains the NEB atoms from all the replicas and one copy of non-NEB atoms from the first replica (presumed to be identical in other replicas). This can be visualized/animated to see how the NEB atoms relax as the NEB calculation proceeds.
The neb_final.py script extracts the final snapshot from each of the M dump files to create a single dump file with M snapshots. This can be visualized to watch the system make its transition over the energy barrier.
There are also a couple pictures on the doc page.
This is from the header of the 2 files. Note that one tool requires you to list the simulation dump files in the right order, the other doesn’t care
make new dump file by combining snapshots from multiple NEB replica dumps
Syntax: neb_combine.py -switch arg(s) -switch arg(s) …
-o outfile = new dump file
each snapshot has NEB atoms from all replicas
-r dump1 dump2 … = replica dump files of NEB atoms
can be in any order
-b dumpfile = background atoms (optional)
first snapshot in this file used as static non-NEB atoms
make new dump file from final snapshots from multiple NEB replica dumps
Syntax: neb_final.py -switch arg(s) -switch arg(s) …
-o outfile = new dump file
snapshots numbered 1 to M = # of replicas
-r dump1 dump2 … = replica dump files of NEB atoms
must be in correct sequence
-b dumpfile = background atoms (optional)
last snapshot in this file used as static non-NEB atoms
Both of these should produce a single new dump file. How you visualize that file is up to you. Use VMD if you like. I’m not clear what you mean by:
I have been attempting to visualise these dumpfiles with the python kit, but have found the documentation for
> Pizza.py very disorienting…
Creating the new dump file (the neb scripts) vs visualizing it (via VMD or Pizza.py) are two different tasks. Can you visualize any dump file with Pizza.py? If not, that is where to start. Or use VMD or some other tool.
Steve