[lammps-users] questions on tmp.profile

I’ve got temperature profile to get thermal conducitivity using “thermal conductivity using fix” and “thermal/conductivity and fix ave/spatial” commands.
The result is as follows.

101000 25
1 -0.7175 0 0
2 0.7175 23.69 291.21
3 2.1525 24.31 299.481
4 3.5875 16 315.053
5 5.0225 16 303.967
6 6.4575 16 298.175
7 7.8925 16 308.913
8 9.3275 23.84 281.964
9 10.7625 24.16 281.042
10 12.1975 16 290.864
11 13.6325 16 307.152
12 15.0675 16 309.009
13 16.5025 16 304.191
14 17.9375 23.35 339.291
15 19.3725 24.65 311.915
16 20.8075 16 313.163
17 22.2425 16 304.582
18 23.6775 16 300.64
19 25.1125 16 282.925
20 26.5475 23.56 280.165
21 27.9825 24.44 292.552
22 29.4175 16 298.56
23 30.8525 16 295.138
24 32.2875 16 289.97
25 33.7225 16 271.865

The direction of thrmal propation is z axis.
The z length was 34.439999 A and I determine delta of “fix ave/spatial command” as 34.439999/24 ~ 1.435 A since I use 24 bins in “fix thermal/conducitivity command”.

I think the first 1 layer of the result is the same with 25 layer (34.439999 - 0.7175 ~ 33.7225)
and the 1 layer may be ignored. (It should appear by a certain bug of LAMMPS, I guess)

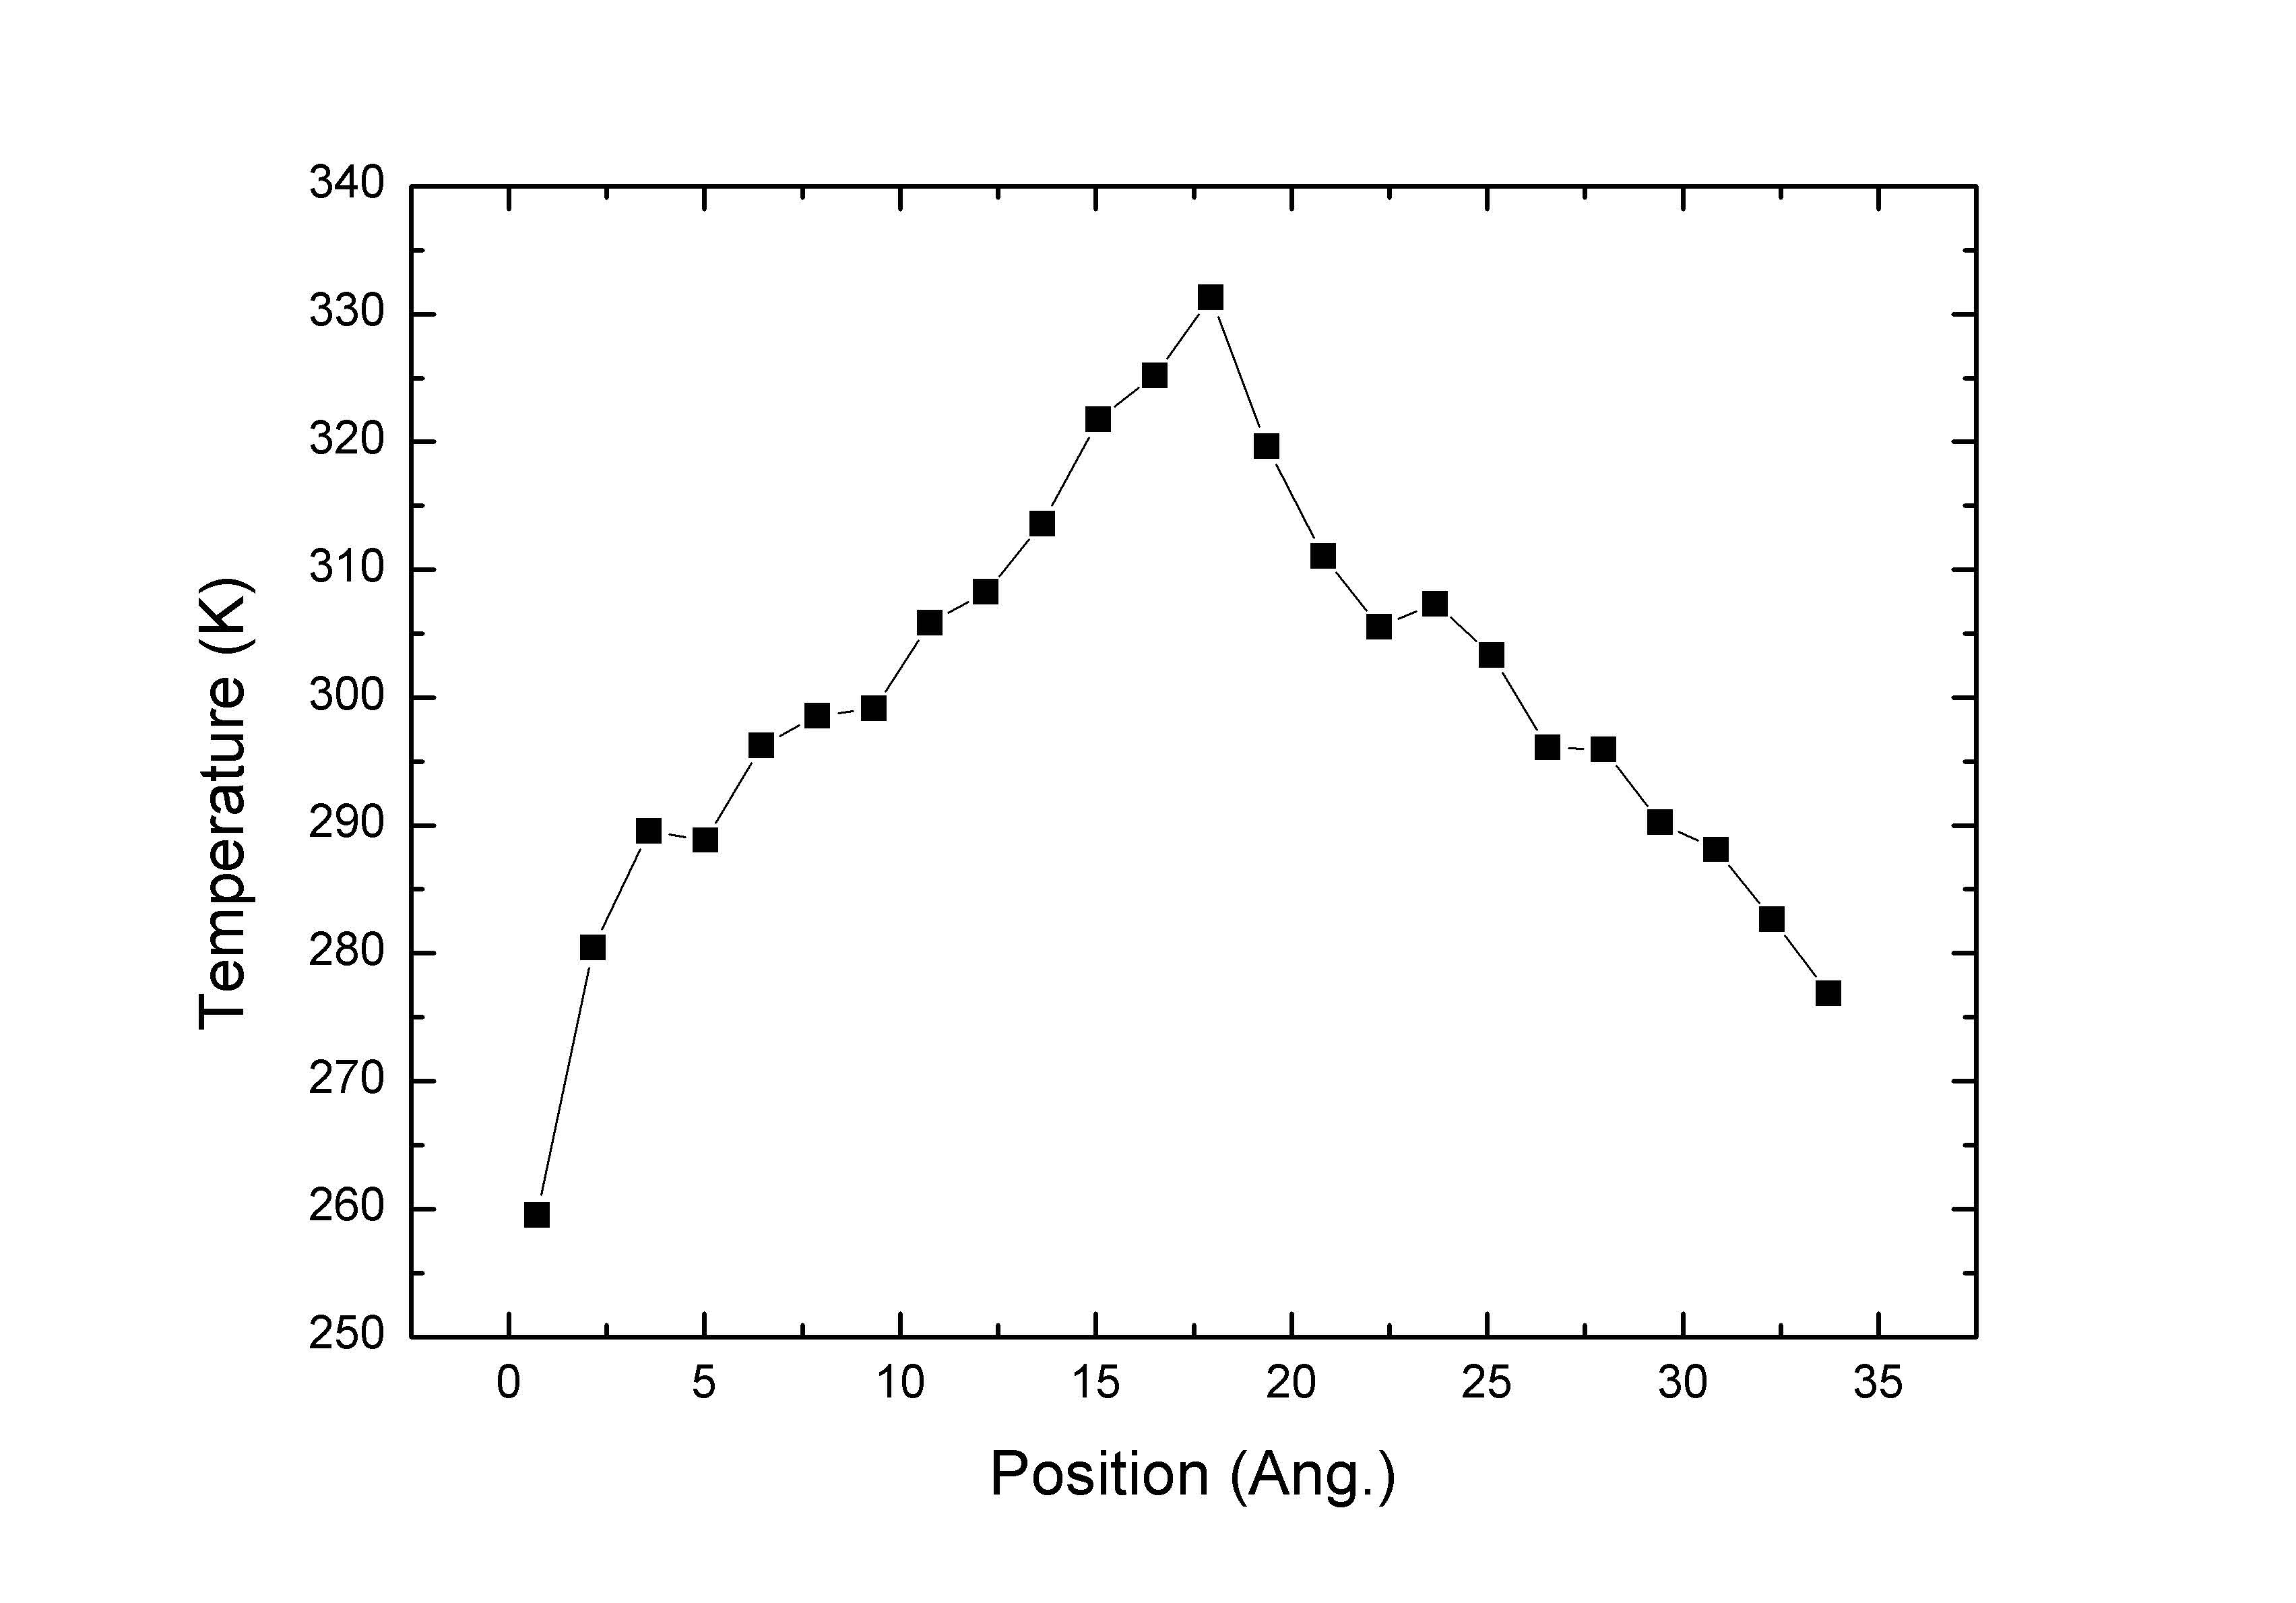
The result does not show monotonous trend but exhibit. somewhat rugged form.
Thus, I increase the delta two times (2.87 A) and change swap number from 1 to 2 and the corresponding result is
as follows.

101000 13
1 -1.435 0 0
2 1.435 48 304.582
3 4.305 32 299.893
4 7.175 32 296.51
5 10.045 48 279.546
6 12.915 32 303.297
7 15.785 32 314.86
8 18.655 48 346.408
9 21.525 32 320.751
10 24.395 32 288.373
11 27.265 48 279.248
12 30.135 32 292.802
13 33.005 32 261.722

It still does not show monotonous linear form.
In spite of it, Is it all right? May I take dT/dz as (346.408-261.722)/(33.005-18.655).

Otherwise, should I have more monotonous result and should it has more linear shape?
If so, what points should I check in running the simulation to get such a result?

Is it common to determine delta to be length/(number of bins of “fix themal/conducitivity command”) as such in my first try?
Otherwise, should it be multiple of it or so generally?

Cheers,

Luke

It looks to me like you need to sample longer, and/or swap more frequently. Don't use fewer bins.
Matt

Quoting "JhonY. I." <[email protected]...>:

In addition to Matt’s suggestion, again it helps if you post a graph instead of putting the numbers in a table form, especially for the question you are asking.

Thanks a lot for your advices really, Matt and Vikas.
I’ve tested variation of conditions on fix thermal/condcutivity and fix ave/spatial.

As best one among them, I’ve got attached result (figure.jpg) using
fix 3 all ave/spaitial 200 1000 20000 z lower 1.4345 …
fix flux all thermal/conductivity 40 z 24 swap 2

It seems that the tmp profile near thermal sink (1st layer) is too steep while tmp profile seems somewhat fine in other region including that of thermal source (14 layer).
This (problem on abstruptness near thermal sink) has been the common tendency in my other tests in which the condition is varied (I’ve also tested frequency of 20 or 25 instead of 40 in “fix thermal/conductivity command”).

How about the result? Will it be fine in spite of it?
Otherwise, should I take more optimal data?

It is hard to take better profile near thermal sink.
Is there any recommendable way to get good data near thermal sink region?

Cheers,

Luke

figure.jpg

Dear Luke,
First, I think you need to run your simulation for much longer time (how long did you run?).
Second, I wanted to ask that is your system exactly symmetric around layer 14? I mean to say that does the center of the layer 14 exactly matches with the center of the thermostat? I am asking this because of your two phase system. Make sure this indeed is true.
Third, the abrupt portion (near thermal sink and source) is quite normal for systems which have high thermal conductivity. But in past literature, I have seen other way round. The change is much sharper near thermal source. So, you may want to check that also.

But in all, I think You need to run your simulations much longer. What are the error bars associated with your temperature averaging?

Best Regards,
Vikas