Dear All,
I tried to run moltemplate for 2bead.lt, peptide.lt
(http://www.moltemplate.org/)
but it gives error: Error: There are no atoms in your system.
How can I solve this problem?
Best Wishes!
Dear All,
I tried to run moltemplate for 2bead.lt, peptide.lt
(http://www.moltemplate.org/)
but it gives error: Error: There are no atoms in your system.
How can I solve this problem?
Best Wishes!
Hello Yanqing
In this example, you are supposed to use moltemplate.sh this way:
moltemplate.sh system.lt
You will get the "no atoms in your system" error if you run
moltemplate.sh this way:
moltemplate.sh 2bead.lt
or
moltemplate.sh peptide.lt
This is because these two files ("2bead.lt" and "peptide.lt")
contain only definitions of molecules. After defining a type of
molecule, you must use the "new" command to instantiate it (to make
copies of it). The system.lt file uses the "new" command to create 27
peptide molecules (a 3x3x3 array of them). Here is an excerpt from
that file:
-------- system.lt --------
import "peptide.lt"
# Create 27 peptides in a rectangular grid
peptides = new Peptide [3].move(0, 0, 30.0)
[3].move(0, 30.0, 0)
[3].move(30.0, 0, 0)
# NOTE: If you just want to make a single copy of the molecule,
# do this instead:
# peptide = new Peptide
# Specify the periodic boundary conditions.
write_once("Data Boundary") {
0 90.0 xlo xhi
0 90.0 ylo yhi
0 90.0 zlo zhi
}
# ("Data Boundary" information usually goes in the "system.lt" file,
# but you can put this information anywhere you like. Either way,
# it will end up in the "system.data" file which moltemplate.sh creates.)
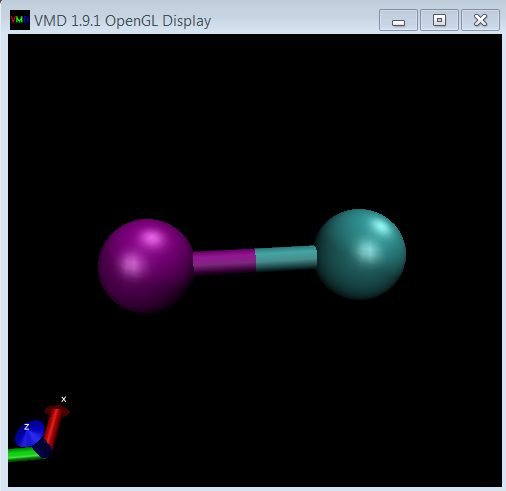
To answer your question about visualization,
1) install VMD.
2) then run moltemplate this way:
moltemplate.sh -vmd system.lt
(I've never tried this in windows or a mac, but it works in ubuntu
linux. This uses Axel's topotools VMD plugin to read the
"system.data" file created by moltemplate.sh.)
I attached a file ("README_visualize.txt") that explains an
alternative way to do this.
To make the graphics look pretty, select the
"Graphics"->"Representations" menu in VMD, and change the "Draw Style"
and colors. You may want to change the "Display"->"Display Settings"
as well. (The default perspective settings drive me crazy.)
Andrew
README_visualize.txt (3.93 KB)
Hi Andrew,
Thanks very much for your information.
I added one line at the end of 2bead.lt file:
2bead = new 2bead
Then compile and visualize it by using VMD. It works.
All the software were used in windows.
I think maybe you can add this trick to your website or somewhere else
It is very helpful to get a clue what’s the component looks like after you create it.
Best Wishes!
Glad it worked in windows!
I might change the web page to draw more attention to the “-vmd” argument.
Thanks.
Andrew
P.S.
One small note: Currently the default periodic boundary conditions are a box of size 200x200x200. (Of course, eventually, you probably should add a write_once(“Data Boundary”) section to change this. But no need to worry about this detail until later, when you are ready to run a simulation.) Cheers.
Hi, Andrew,
Let me make the whole produce clear:
added one line at the end of 2bead.lt file:
2bead = new 2bead. I think the same works for other component
Then run the command in the cygwin environment: moltemplate.sh 2bead.lt
Get the data file 2bead.data
Run this in the vmd command window: topo readlammpsdata 2bead.data full
Works.