Hello,
I am trying to plot a multi (3) component Pourbaix Diagram with the statility heatmap. To do so I am basing my code on this exemple : 2017-12-15-Plotting a Pourbaix Diagram
I managed to plot the 3 components diagram, and some heatmap for diagram with only one component but each time I switch from 1 to 2 or 3 component (I just switch the species list from Species = [“Ti”] to Species = [“Ti”,“Cr”,“Sn”] ) I always get the error : “ValueError: Composition of stability entry does not match Pourbaix Diagram” which does not make any senses. If the code works for one elements what does not it work for 3 ? I cannot find the issue here, if someone as any idea of how to correct this it would be great.
Louis Poitevin
I found the origin of the error, however I still have no clear idea of how to fix it.
in the pourbaix_diagram.py file of the analysis folder of pymatgen package, the function responsible for getting and plotting the stability domains of a given entry is “”“plot_entry_stability()”“”. The error occurs when this method is calling the get_decomposition_energy:
“”“stability = self._pbx.get_decomposition_energy(entry, pH, V)”“”
This method does a test comparing “”“entry_pbx_comp != pbx_comp”“” which are define as this :
    pbx_comp = Composition(self._elt_comp).fractional_composition

    entry_pbx_comp = Composition({elt: coeff for elt, coeff in entry.composition.items() if elt not in ELEMENTS_HO}).fractional_composition
The issue is that for a n component plot, like for alloys, the pbx_comp take the following value : “X_{1/n}Y_{1/n}” but the entry_pbx_comp is still a single component value (the exemple below might be clearer).
=====================Pourbaix Entry======================
entry of Pourbaix diagram are :
entry_pbx_comp : Sn1
pbx_comp : Cr0.33333333 Sn0.33333333 Ti0.33333333
I found a way of making it work, but I am not sure about the validity of the data plotted. I just took out the test comparing entr_pbx_comp to pbx_comp.
Hi LouisPoitevin, sorry for the delayed response. Generally - the assumption of the get_entry_stability method is that the entry for the stability calculation has the same composition as the constraint of the pourbaix diagram.
As it’s currently implemented, the heatmap functionality is intended to plot the stability of a specific material (or mixture of materials and/or ions) against the minimum energy decomposition product in pourbaix space, so if you don’t use a material/mixture that fulfills the composition constraints, the decomposition products being considered (the materials and material mixtures on the pourbaix “hull”) aren’t valid reaction products.
In principle, one could find the minimum energy states in pourbaix space that included a selected 1-component material (i.e. minimized the energy of the remaining two components according to the balance of composition), and then plot the pourbaix stability of those minimized states relative to the hull in a way that fulfills the compositional constraint, but that’s not currently implemented and would also change some of the normalization assumptions of the results (currently the “per atom” normalization is implicitly per atom of decomposing material, and the number of decomposing atoms would be changing since the minimal energy states could be changing).
Hi !
Thank you for your response, the situation is clearer.
After going in the package code (for different reasons, the main one being modifying the prefactor to have Pourbaix diagram at different temperatures than 25°C) I found (as I said in my last message) a way to plot heatmap on multi-component Pourbaix Diagram by modifying
get_decomposition_energy(self, entry, pH, V):
What I did is simply remove the test
if entry_pbx_comp != pbx_comp:
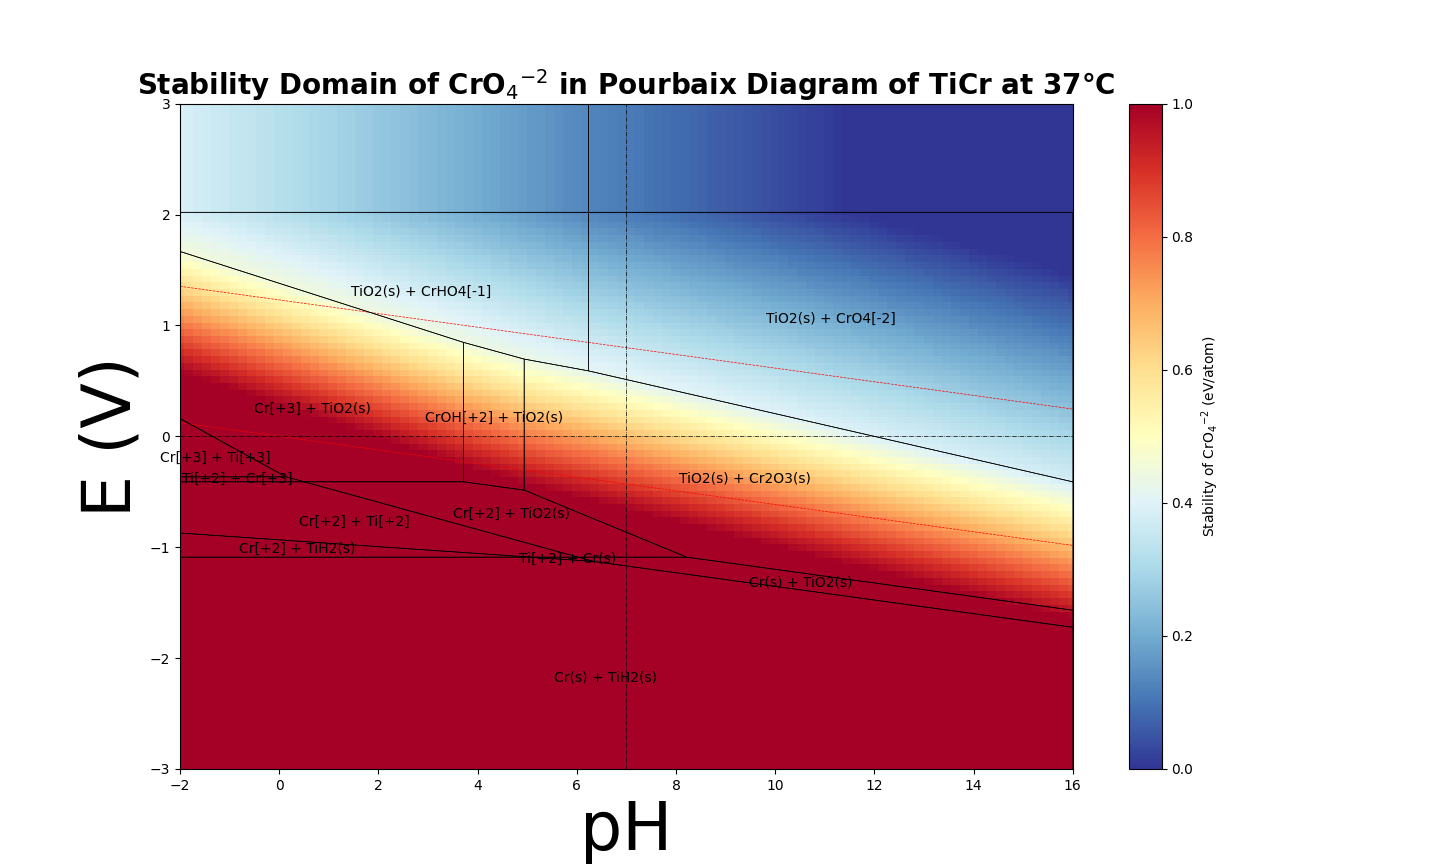
This way I was able to plot heatmaps like the following :
However I don’t know what is the precision of these maps, can I trust/use them ? They look quite ok but I am no expert in this field.
(also on a completely different subject, these Pourbaix plots don’t handle well the positioning of the labels, I have not looked too deep in this yet so maybe I missed a feature to avoid this but I cannot get them to be readable in most cases)
Right - that’ll make the code work but the meaning of the pourbaix diagrams is ambiguous because you’ve violated the assumptions of the code (which is that the material or mixture whose stability you’re trying to estimate has the same composition as the pourbaix diagram’s assumed composition). The difference between the energy of that material and the minimal free energy material won’t really make sense if the two compositions are different.
I guess there’s a different interpretation one could make of what you’re plotting which is that the map is of the “excess” free energy of both the decomposition reaction and the formation of any further stable materials/ions relative to their constituent reference states at standard conditions, but this isn’t really a “stability” in the sense that pymatgen’s pourbaix diagram was intended to plot, it’s more of a mixed formation energy and stability, and I’m not sure what the physical meaning of this quantity would be.
Take the second example - there’s a big region in the upper right hand corner of the plot that has CrO4[2-] as part of the stable phase mixture that’s pourbaix stable, but the heatmap says that it’s “unstable” for a large portion of that region, which I think is because there’s “extra” energy associated with the TiO2 forming that’s present in the minimal pourbaix state but not in the state whose stability you’re trying to describe. Because CrO4[-2] scales more negatively than the TiO2 + CrO4[2-], it eventually hits zero, but I don’t think this has a meaningful physical interpretation.
Actually - on second thought I’m surprised this happens at all. Implicitly I think the physical interpretation of what you’re doing would be that the stability of the material you’re estimating is Ti(s) + CrO42-, because Ti should have 0 free energy as a reference state that doesn’t scale with any of the pourbaix state variables, but that should never be more stable than TiO2 in the oxidizing region. I’ll try to think about this a bit more, might need to dig into the code myself to see if I can make sense of it.
As for the labels - it’s all just matplotlib on the backend, so you should be able to modify text via the matplotlib api.
Thank you again for your thorough answer.
Regarding the stability region of CrO4[2-], I must say that when I first saw the graph I was not so surprised. There is clearly a stability gradient inside the region where the Pourbaix Diagram is giving chromate anions to be predominant, but it seems logical that the stability could not be total for the entire region, it is the point of such maps to show the stability of element and confront them to the Pourbaix Diagram, which are only giving the most stable element in the region. Besides the gradient of the stability map is correctly correlated to the Pourbaix Diagram lines, which is an expected result.
With this I think that the map, even though not as clear as before, could remains a correct qualitative tool to assess the stability of element don’t you think ?
What is sure is that the interpretation of these results must be done with caution.
We are facing the same problem (stability heatmap) here. It is noticed that the web version of Pourbaix Diagram App can show the stability heatmap for multi component Pourbaix diagram without issues, and it seems to be a plotly (?) implementation instead of matplotlib. How can we achieve the same functionalities using pymatgen? Thank you.