Nfreq parameter in fix ave/correlate

Dear all,

I am still a bit confused about what Nfreq parameter does in LAMMPS fix ave/correlate command. For example, when I run a simulation in a total timestep of 200,000 with Nevery =1 and Nrepeat = 20. My question is what is the difference if I set Nfreq=2000000 and 200?

I find in the output folder, for Nfreq=2000000, there is only one series of the output data. And for Nfreq=200, there are 100 (or 10). But I don’t really know the relationship between those output data. Which one has a better average? Is it the same if I average the data from Nfreq=200, as I take the data from Nfreq=200000 directly?

Best wishes,
Sunnia

Dear all,

I am still a bit confused about what *Nfreq* parameter does in LAMMPS fix
ave/correlate command. For example, when I run a simulation in a total
timestep of 200,000 with Nevery =1 and Nrepeat = 20. My question is what is
the difference if I set Nfreq=2000000 and 200?

​please have a look at the documentation for fix ave/time, which explains
the concept behind these parameters more cleanly.

axel.​

Then how should I understand the output file? e.g.

Timestep Number-of-time-windows

Index TimeDelta Ncount c_1[4]*c_1[4]

0 20
1 0 1 0.000592207
2 1 0 0.0

20 19 0 0.0
20 20
1 0 21 0.000478826
2 1 20 0.000476418

20 19 2 0.000531485

200000 20
1 0 21 4.52129e-06
2 1 20 4.54477e-06

20 19 2 5.43439e-07

Does mean the ‘200000 20’ one averaged all the calculations out + itself, or they are equivalently calculated and I should average everything out on my own?

Best

Sunnia

Then how should I understand the output file? e.g.

​first of all, rather than making an effort to follow my advice, you are
essentially repeating your question. if you have seen previous posts by me
in the mailing list archives, you should have seen, that is is one of the
things, that i strongly dislike.

anyway, ​you *cannot* reverse engineer what is happening from the output.
output always describes the amount of data contained, *not* how it has been
accumulated. so the very information, you are looking for, is lost. thus
you *must* read and _understand_ the documentation. that is your only
option and it is not so complicated, if you make a proper effort, and do
not read it with some preconceived notions of what things should mean.
there are multiple examples given to illustrate what is done.

is it so difficult to understand that?
- Nfreq determines how often the result of a chunk of averaged (or
correlated) data is output
- Nrepeat determines how many samples this chunk is averaged (or
correlated) over
- Nevery determines the spacing of the nrepeat samples of data being used
(i.e. 1 is every step)

...and always remember: the most effective learning tool is to make tests
for yourself. set up a tiny test system with only a few atoms, run a very
short simulation, dump the relevant output for every step and then you can
manually compute what LAMMPS will generate as output and compare.

axel.

Dear Axel,

Thank you very much for replying my email. I’m sorry for keeping bothering you with this simple question which perhaps looks straightforward for you (and others), and I did read all the mailinglist questions regarding ‘ave/correlate’ but unfortunately still didn’t get there. I admit that it is my fault of not organizing my questions correctly and properly, but I will try then.

  • Nevery determines the spacing of the nrepeat samples of data being used (i.e. 1 is every step) Yes I know.

The question comes to Nrepeat and Nfreq. My understanding is: you take the data every Nfreq, and calculate the autocorrelation function out of this Nfreq data, wherein the output autocorrelation function is C(deltaTime), and deltaTime = multiple of Nrepeat. So you get different ACF every Nfreq, and each Nfreq ACF (let’s call it as ACF(Nfreq=j)) can be different. If that right?

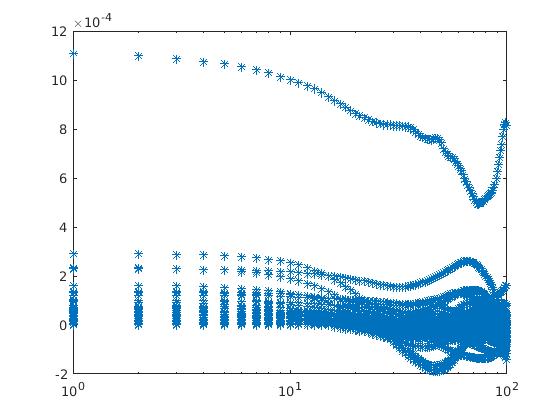
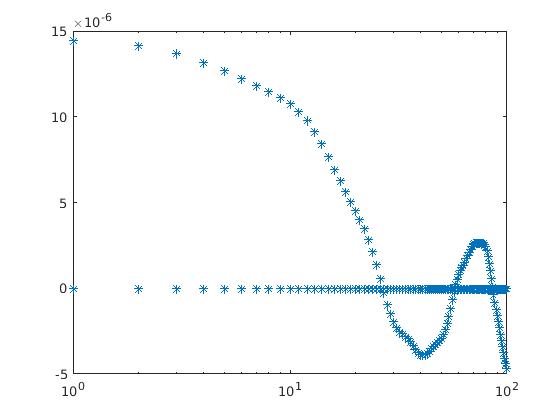
I did try out running my simulation in with different parameters but they don’t actually correspond to what I would expect from the scripts, and I don’t really understand why people would like to set the Nfreq small since it gives bad statistics (if I understand correctly). If you don’t might - here I attached two figures for different choices of Nfreq: let one with Nfreq = Nrepeat, and the right one with Nfreq=total running step. x-axis stands for the time series and y-axis stands for the out put ACF.
short.jpglong.jpg

​Sorry for bothering so much but I will think twice (or twice twice) before I ask the next question!

Thank you very much for your patience!!

All the best,

Sunnia

Dear Axel,

Thank you very much for replying my email. I'm sorry for keeping bothering
you with this *simple* question which perhaps looks straightforward for you
(and others), and I did read all the mailinglist questions regarding
'ave/correlate' but unfortunately still didn't get there. I admit that it
is my fault of not organizing my questions correctly and properly, but I
will try then.

- Nevery determines the spacing of the nrepeat samples of data being used
(i.e. 1 is every step) Yes I know.

The question comes to Nrepeat and Nfreq. My understanding is: you take the
data every Nfreq, and calculate the autocorrelation function out of this
Nfreq data, wherein the output autocorrelation function is C(deltaTime),
and deltaTime = multiple of Nrepeat. So you get different ACF every Nfreq,
and each Nfreq ACF (let's call it as ACF(Nfreq=j)) can be different. If
that right?

this depends on the specific settings and particularly the "ave" mode
selected. i must repeat: read the documentation! it is all there, you seem
to be skipping over details. but more importantly, you seem to be reading
it with pre-conceived notions of what is happening that are incorrect.

the nfreq data samples are *only* collected on the ​nrepeats steps before
and including the ​nfreq steps.

I did try out running my simulation in with different parameters but they
don't actually correspond to what I would expect from the scripts, and I
don't really understand why people would like to set the Nfreq small since
it gives bad statistics (if I understand correctly). If you don't might -
here I attached two figures for different choices of Nfreq: let one with
Nfreq = Nrepeat, and the right one with Nfreq=total running step. x-axis
stands for the time series and y-axis stands for the out put ACF.

​this is not what i recommended you to do and also seems to indicate, that
you have no good understanding of the statistical noise and convergence of
the property ​you are sampling and auto-correlation functions in general.
most of the data your are plotting is pointless to look at, as it is
clearly just unconverged noise. as before, we are now getting to a point
again, where you should obtain proper consulting and training from your
adviser/supervisor. it is becoming increasingly obvious that your progress
is hindered particularly by your lack of training. i have to repeat, that
this mailing list is not classroom and we have no time to teach everybody
personally what they should have learned *before* doing simulations on
their own and without supervision.

​Sorry for bothering so much but I will think twice (or twice twice)
before I ask the next question!

BTW: these plots are useless without knowing what you are actually
auto-correlating.
at any rate, since you need to practice, you should start with something
that is well understood and described in MD text books, e.g. velocity
auto-correlations.

axel.​

short.jpg

long.jpg